

Question: Analyze the quality cost data for assinment#1 posted on a pdf file spearatly. what implications does this suggests to managment? TABLE 2.2 Quality cost statement
Analyze the quality cost data for assinment#1 posted on a pdf file spearatly. what implications does this suggests to managment? 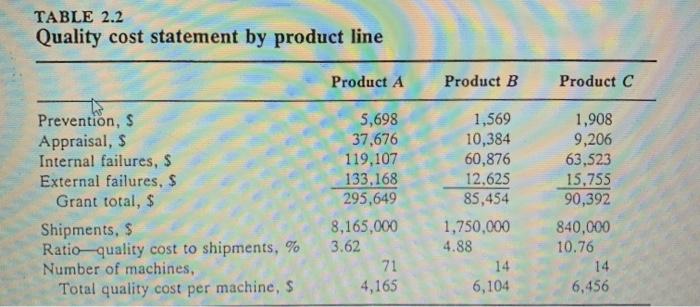
TABLE 2.2 Quality cost statement by product line Product A Product B Product C Prevention, $ Appraisal, $ Internal failures, $ External failures, $ Grant total, $ Shipments, $ Ratio quality cost to shipments, % Number of machines, Total quality cost per machine, s 5,698 37,676 119,107 133,168 295,649 8,165,000 3.62 71 4,165 1,569 10,384 60,876 12,625 85,454 1,750,000 4.88 14 6,104 1,908 9,206 63,523 15,755 90,392 840,000 10.76 14 6,456
Step by Step Solution
There are 3 Steps involved in it
1 Expert Approved Answer
Step: 1 Unlock

Question Has Been Solved by an Expert!
Get step-by-step solutions from verified subject matter experts
Step: 2 Unlock
Step: 3 Unlock