

Question: Analyze the result of each graph Histogram Mean '119 Std. Dev. - 1.181 N - 290 I] If you ever consider smart cooking appliances. please
Analyze the result of each graph
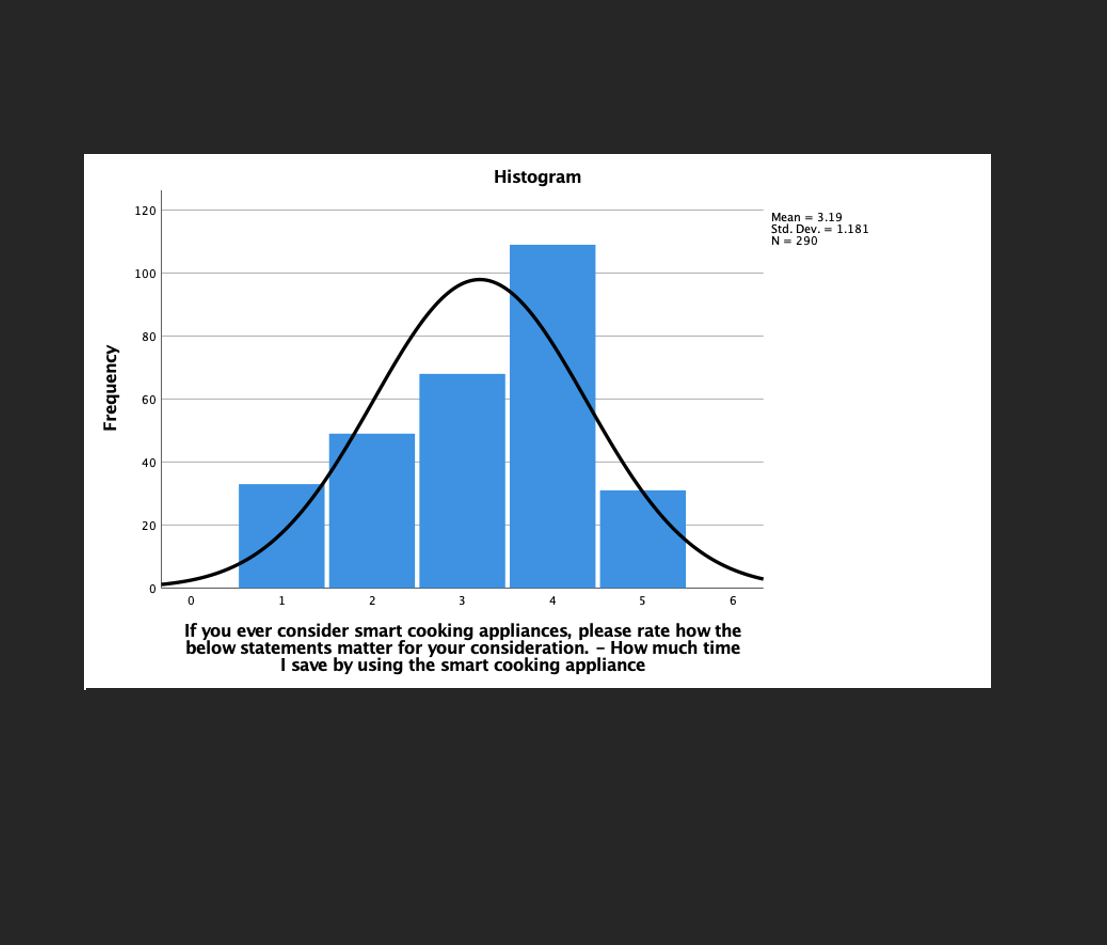
Histogram Mean '119 Std. Dev. - 1.181 N - 290 I] If you ever consider smart cooking appliances. please rate how the below statements matter for your consideration. - How much time I save by using the smart cooking appliance
Step by Step Solution
There are 3 Steps involved in it
1 Expert Approved Answer
Step: 1 Unlock

Question Has Been Solved by an Expert!
Get step-by-step solutions from verified subject matter experts
Step: 2 Unlock
Step: 3 Unlock