

Question: Analyze the SERS data and discuss each data point with relevant previous published data or articles. Scan / Spectra No. Samples Proteins Intensity Peak Intensity
Analyze the SERS data and discuss each data point with relevant previous published data or articles.
| Scan / Spectra No. | Samples | Proteins | Intensity Peak | Intensity Bottom | Raman Intensity |
| Scan 1 | Sample 1 | Protein A | 1883 | 524 | 1359 |
| Protein B | 1094 | 174 | 920 | ||
| Protein C | 2187 | 381 | 1806 | ||
| Scan 2 | Sample 2 | Protein A | 2686 | 392 | 2294 |
| Protein B | 1593 | 294 | 1299 | ||
| Protein C | 2915 | 569 | 2346 | ||
| Scan 3 | Sample 3 | Protein A | 2261 | 432 | 1829 |
| Protein B | 1201 | 154 | 1047 | ||
| Protein C | 2683 | 383 | 2300 |
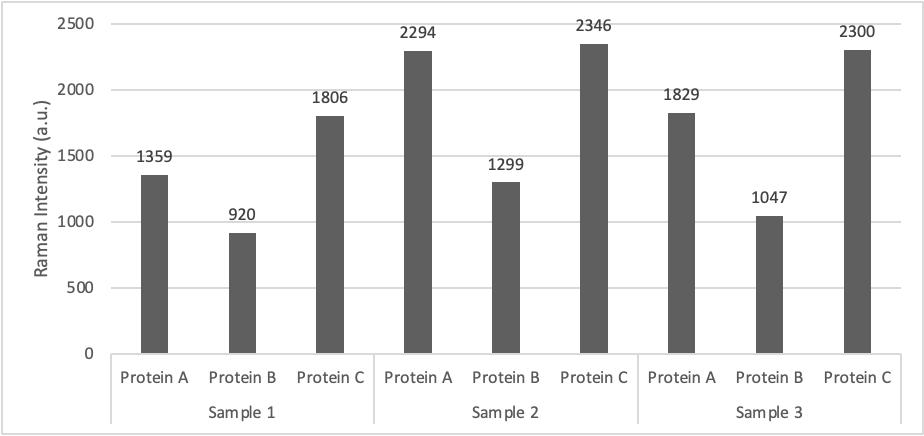
Raman Intensity (a.u.) 2500 2000 1500 1000 500 0 1359 920 2294 1806 1299 2346 Protein A Protein B Protein C Protein A Protein B Sample 1 Sample 2 1829 2300 1047 Protein C Protein A Protein B Protein C Sample 3
Step by Step Solution
There are 3 Steps involved in it
1 Expert Approved Answer
Step: 1 Unlock

Question Has Been Solved by an Expert!
Get step-by-step solutions from verified subject matter experts
Step: 2 Unlock
Step: 3 Unlock