

Question: Analyze the table in words Table 4:panel pooled regression analysis ROA -305 -121*** Coef. St.Emr. t-value p-value [95% Conf Interval] Sig LEVERAGE 213 046-4.63 0.000
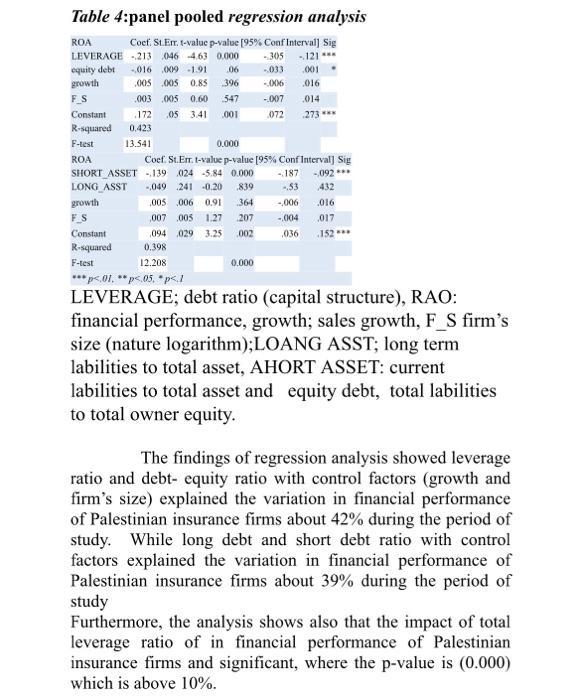
Table 4:panel pooled regression analysis ROA -305 -121*** Coef. St.Emr. t-value p-value [95% Conf Interval] Sig LEVERAGE 213 046-4.63 0.000 equity debt -.016 009 -1.91 .06 growth 005 0.85 396 547 -.033 001 -006 016 005 .003 005 0.60 F_S -.007 .014 172 .05 3.41 001 072 273 *** 0,423 13.541 Constant R-squared F-test ROA SHORT ASSET-139 024 -5.84 0.000 -187 LONG_ASST -,049 241 -0.20 .839 growth -.53 005 006 0.91 364 -.006 F_S ,007 005 1.27 207 -,004 .036 0.000 Coef. St.Emr. t-value p-value [95% Conf Interval] Sig -092*** 432 .016 017 152*** 094 029 3.25 .002 0.398 12.208 Constant R-squared F-test *** p
Step by Step Solution
3.42 Rating (165 Votes )
There are 3 Steps involved in it
Answer 1 General guidance The answer provided below has been developed in a clear step by step manne... View full answer

Get step-by-step solutions from verified subject matter experts