

Question: Analyze the three following graphs. Explain how these graphs will be useful for managers. Discuss the other uses of CVP Analysis. Discuss the basic assumptions
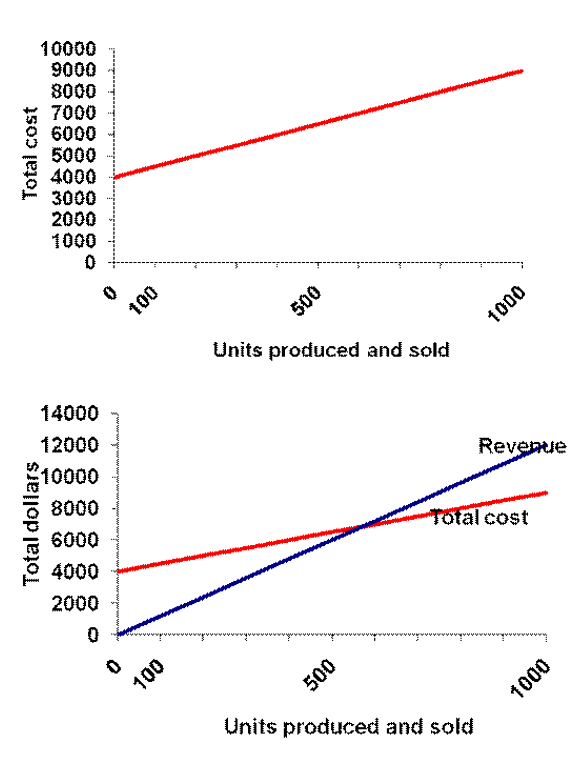
Analyze the three following graphs. Explain how these graphs will be useful for managers. Discuss the other uses of CVP Analysis.
Discuss the basic assumptions for CVP analysis
?
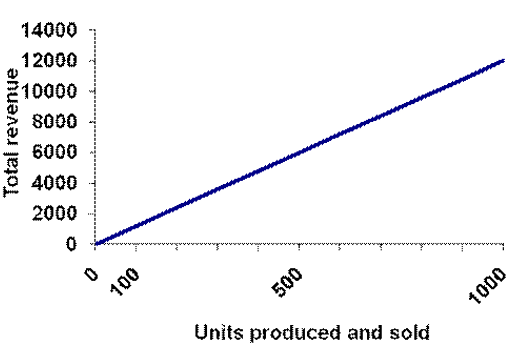
Total revenue 14000 12000 10000 8000 6000 4000 2000 0 100 500 Units produced and sold 1000
Step by Step Solution
There are 3 Steps involved in it
1 Expert Approved Answer
Step: 1 Unlock

Question Has Been Solved by an Expert!
Get step-by-step solutions from verified subject matter experts
Step: 2 Unlock
Step: 3 Unlock