Question: Analyze the time series variable (Year) by rotten tomato score Chart 4 fx A B C D E F G I J K L M

Analyze the time series variable (Year) by rotten tomato scoreAnalyze the time series variable (Year) by rotten

Chart 4 fx A B C D E F G I J K L M N P 1 2 Year by Rotten Tomato Rotten Tomatoes by Year 3 1.2 4 1 5 0.9 1 6 0.8 S 7 0.8 0.7 8 0.6 Rotten Tomato 0.6 9 10 ROTTEN TOMATO 0.5 0.4 0.4 11 0.3 0.2 12 13 =-7E-05x + 0.8089 R2 = 0.0075 0.1 0.2 y = -0.0017x + 4.1991 R2 = 0.004 O 1950 1960 1970 O 1980 1990 2000 2010 2020 2030 1959 1995 2001 2005 2007 2009 2010 2011 2012 2013 2014 2014 2015 2015 5 2016 2016 2016 2017 2017 2017 2018 2018 2018 2019 2019 2019 2020 2020 Year O 18 19

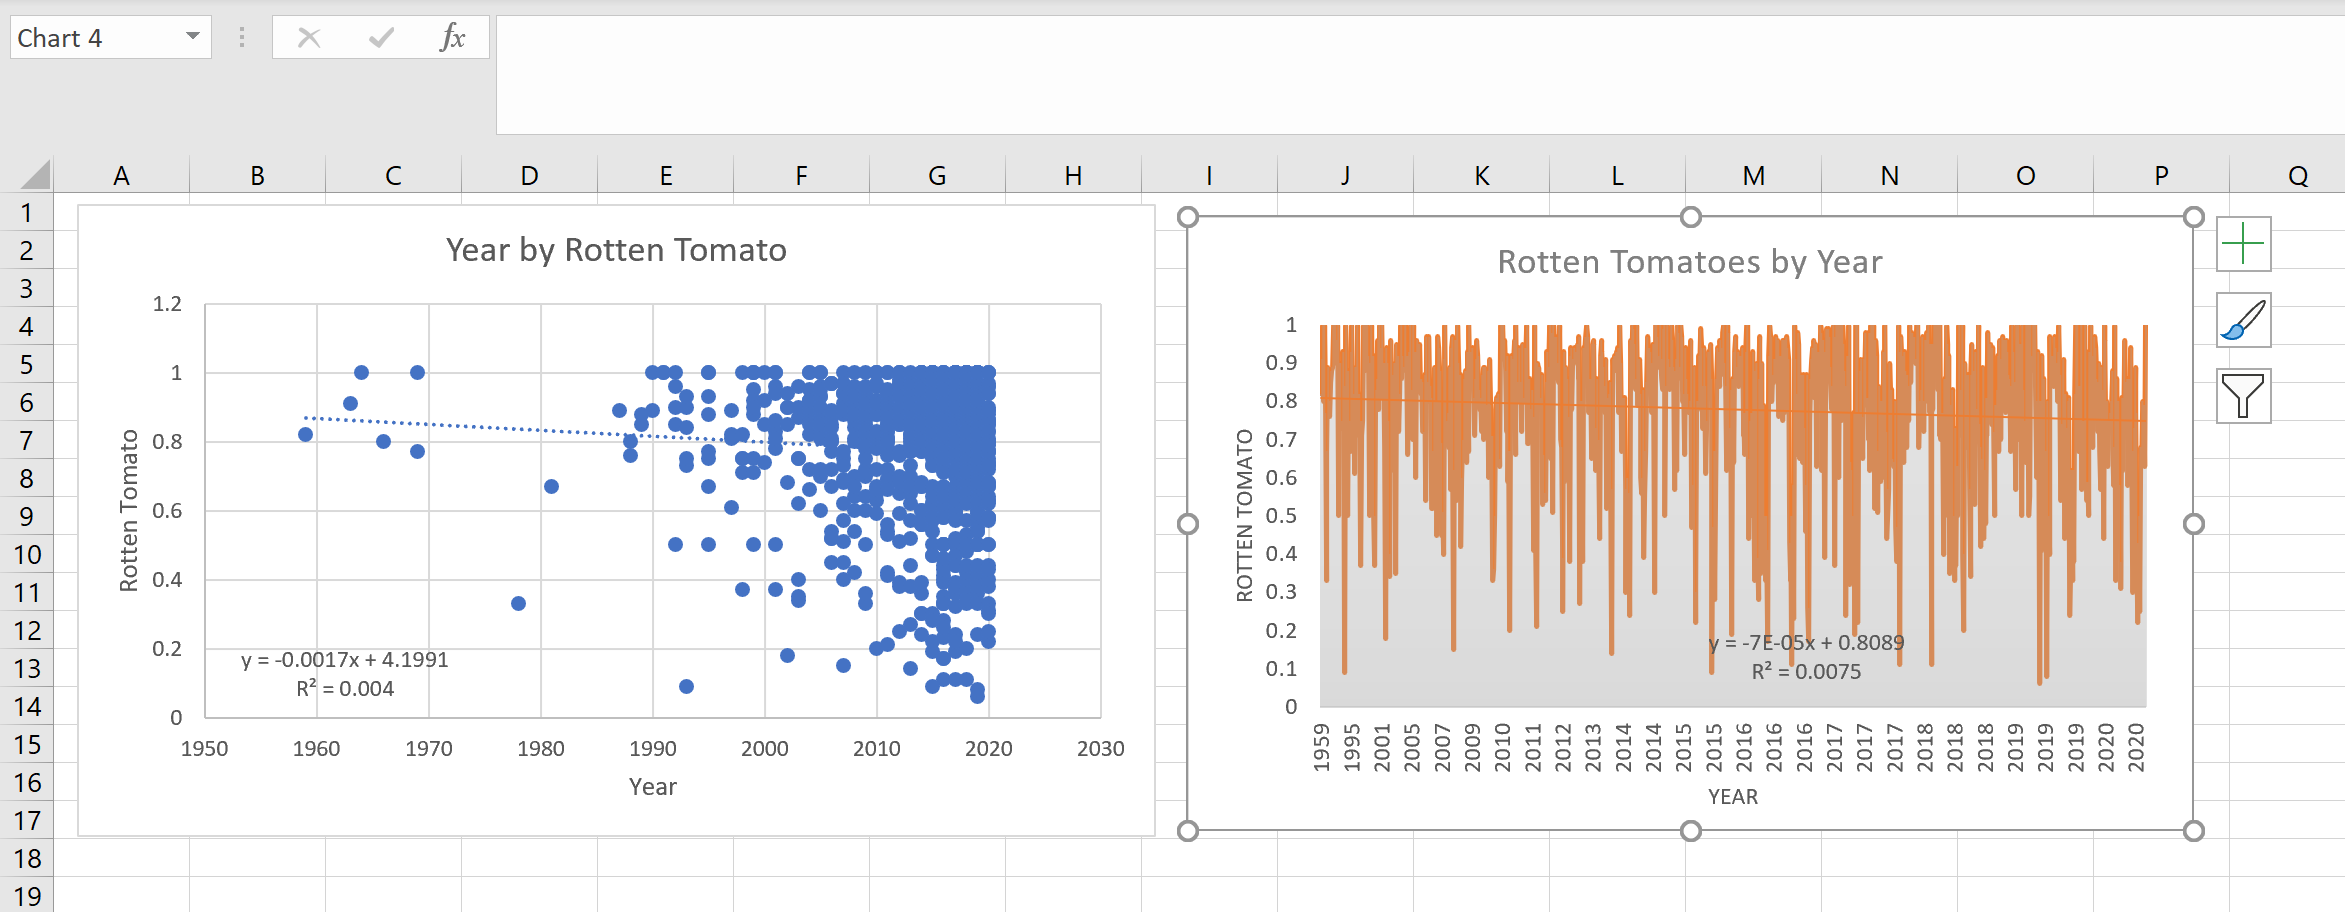
Step by Step Solution

There are 3 Steps involved in it

1 Expert Approved Answer
Step: 1 Unlock blur-text-image
Question Has Been Solved by an Expert!

Get step-by-step solutions from verified subject matter experts

Step: 2 Unlock
Step: 3 Unlock

Students Have Also Explored These Related General Management Questions!