

Question: Analyze the trends over time (increasing, decreasing, fluctuating, etc.). Explain what the numbers might indicate based on the financial statements and your knowledge of accounting
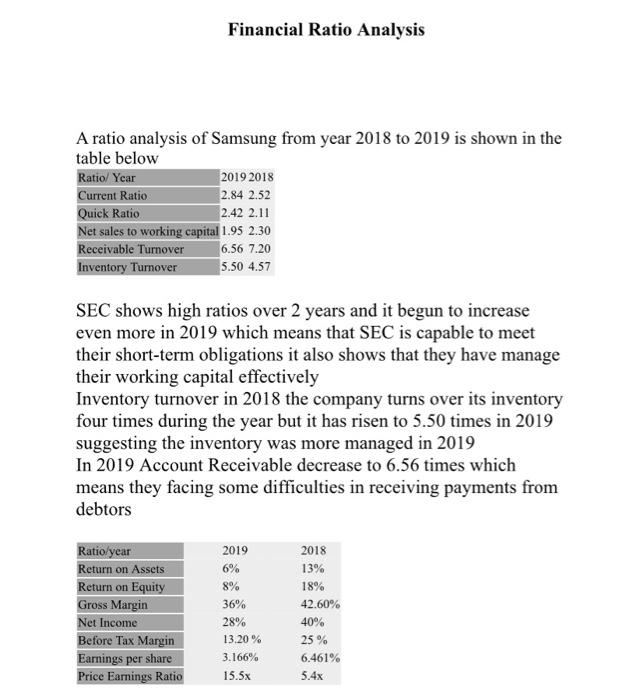
Financial Ratio Analysis A ratio analysis of Samsung from year 2018 to 2019 is shown in the table below Ratio/ Year 2019 2018 Current Ratio 2.84 2.52 Quick Ratio 2.42 2.11 Net sales to working capital 1.95 2.30 Receivable Turnover 6.56 7.20 Inventory Turnover 5.50 4.57 SEC shows high ratios over 2 years and it begun to increase even more in 2019 which means that SEC is capable to meet their short-term obligations it also shows that they have manage their working capital effectively Inventory turnover in 2018 the company turns over its inventory four times during the year but it has risen to 5.50 times in 2019 suggesting the inventory was more managed in 2019 In 2019 Account Receivable decrease to 6.56 times which means they facing some difficulties in receiving payments from debtors Ratio/year Return on Assets Return on Equity Gross Margin Net Income Before Tax Margin Earnings per share Price Earnings Ratio 2019 6% 8% 36% 28% 13.20 % 3.166% 15.5x 2018 13% 18% 42.60% 40% 25% 6.461% 5.4x Financial Ratio Analysis A ratio analysis of Samsung from year 2018 to 2019 is shown in the table below Ratio/ Year 2019 2018 Current Ratio 2.84 2.52 Quick Ratio 2.42 2.11 Net sales to working capital 1.95 2.30 Receivable Turnover 6.56 7.20 Inventory Turnover 5.50 4.57 SEC shows high ratios over 2 years and it begun to increase even more in 2019 which means that SEC is capable to meet their short-term obligations it also shows that they have manage their working capital effectively Inventory turnover in 2018 the company turns over its inventory four times during the year but it has risen to 5.50 times in 2019 suggesting the inventory was more managed in 2019 In 2019 Account Receivable decrease to 6.56 times which means they facing some difficulties in receiving payments from debtors Ratio/year Return on Assets Return on Equity Gross Margin Net Income Before Tax Margin Earnings per share Price Earnings Ratio 2019 6% 8% 36% 28% 13.20 % 3.166% 15.5x 2018 13% 18% 42.60% 40% 25% 6.461% 5.4x
Step by Step Solution
There are 3 Steps involved in it

Get step-by-step solutions from verified subject matter experts