

Question: Analyze the US surface map with radar image overlay* (Image 2),the US infrared satellite imagery (Image 3), the Southwest regioninfrared satellite image* (Image 5), and
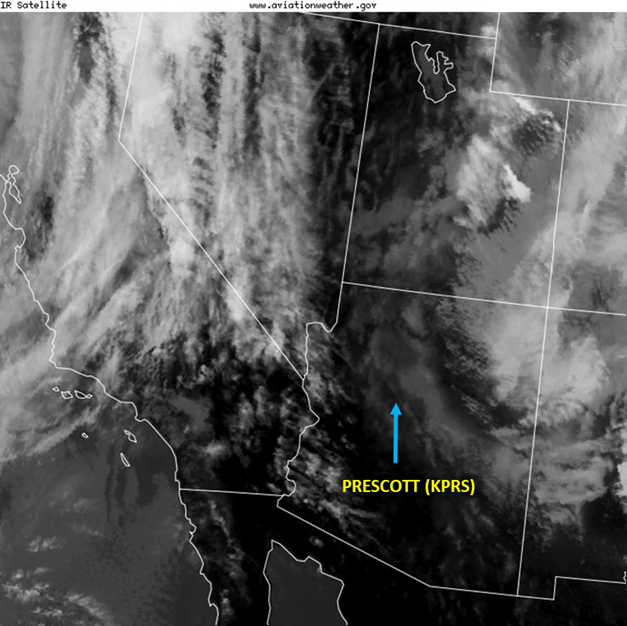
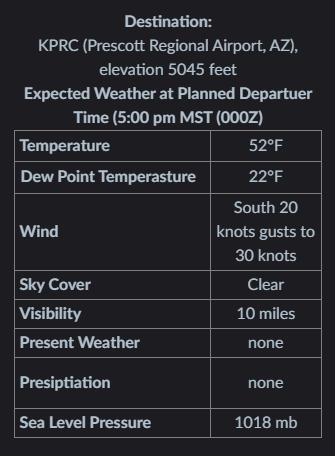
Analyze the US surface map with radar image overlay* (Image 2),the US infrared satellite imagery (Image 3), the Southwest regioninfrared satellite image* (Image 5), and the KPRC surface weatherfor the planned destination (landing) time of 5:00 pm MST (0000 Z) (in the Departure and Destination SurfaceWeather Tables) to identify:
- Specific surface weather features or patterns, such as high andlow-pressure systems, cold and warm fronts, and the pressuregradient (tight or loose) and associated wind speed (strong orweak) in the vicinity of KPRC
- Any fog or clouds in the vicinity of KPRC. Specify if theclouds are layered or convective. If layered, specify if they arehigh or low-level clouds.
- Precipitation (if present, specify intensity) or othersignificant weather in the vicinity of KPRC.
- Any differences between the wind direction and the runwayorientation at KPRC (determined by comparing wind direction withrunway orientation from airport Google Map image (link provided inthe overview section above)).
Image 2:
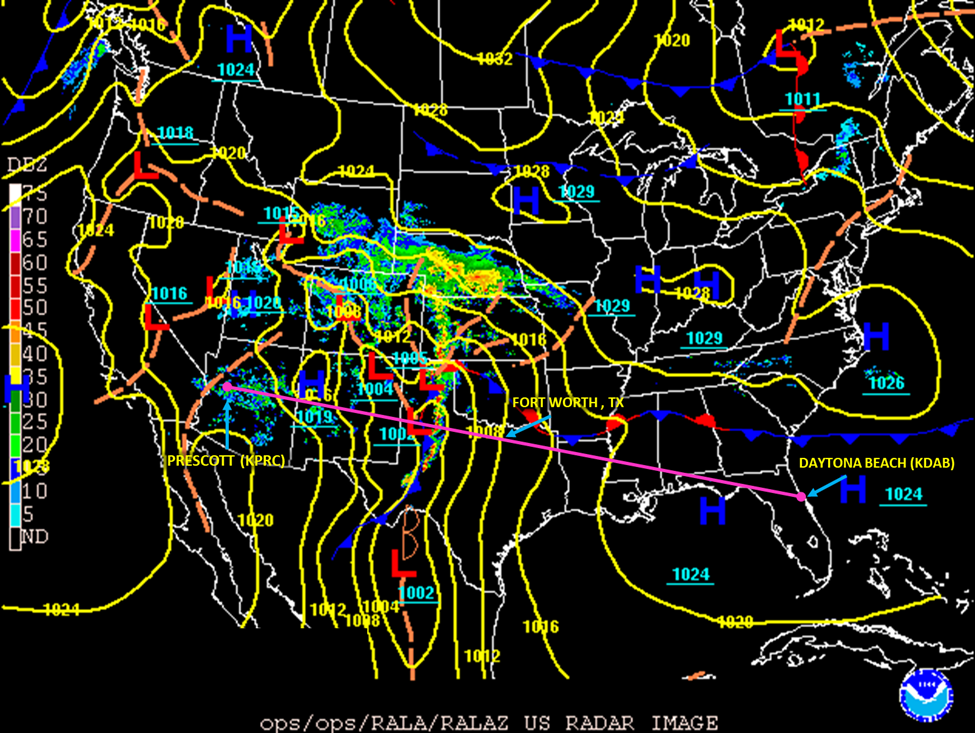
Image 3:
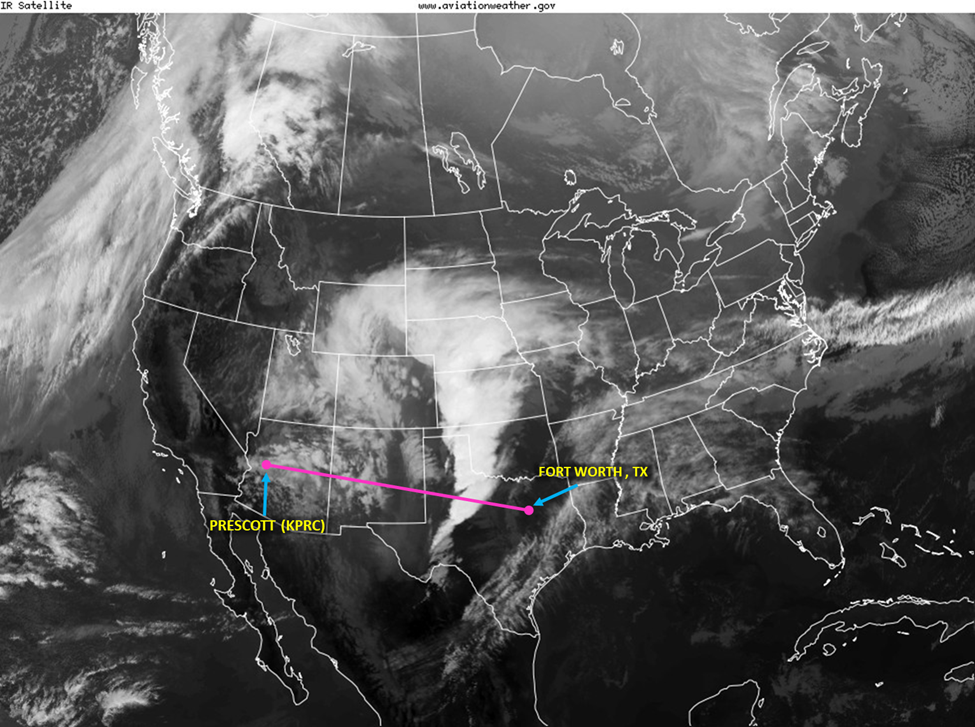
Image 5:
KPRC Weather:
KPRC Google Maps Link:
https://www.google.com/maps/@34.6498173,-112.4294277,709m/data=!3m1!1e3
DEZ 70 65 60 55 M50 45 40 35 30 125 20 1333 10 ND (1824 1018 1016 1024 10161028 1008 PRESCOTT (KPRC) 1020 1019 1012 7004 100 1098 4032 1028 1016 1029 1029 FORT WORTH, TX 1016 1029 1024 ops/ops/RALA/RALAZ US RADAR IMAGE 1011 1026 DAYTONA BEACH (KDAB) 1024 IR Satellite PRESCOTT (KPRC) www.aviationweather.gov FORT WORTH, TX IR Satellite B0 www.aviationweather.gov m PRESCOTT (KPRS) Destination: KPRC (Prescott Regional Airport, AZ), elevation 5045 feet Expected Weather at Planned Departuer Time (5:00 pm MST (000Z) Temperature Dew Point Temperasture Wind Sky Cover Visibility Present Weather Presiptiation Sea Level Pressure 52F 22F South 20 knots gusts to 30 knots Clear 10 miles none none 1018 mb
Step by Step Solution
3.32 Rating (161 Votes )
There are 3 Steps involved in it
Answer 1 Specific surface weather characteristics or patterns in the neighborhood of KPRC such as hi... View full answer

Get step-by-step solutions from verified subject matter experts