

Question: Analyze Wald interval's coverage using confidence intervals and investigate their frequency performance over repeated realizations of the experiment. Consider different values of p. Write the
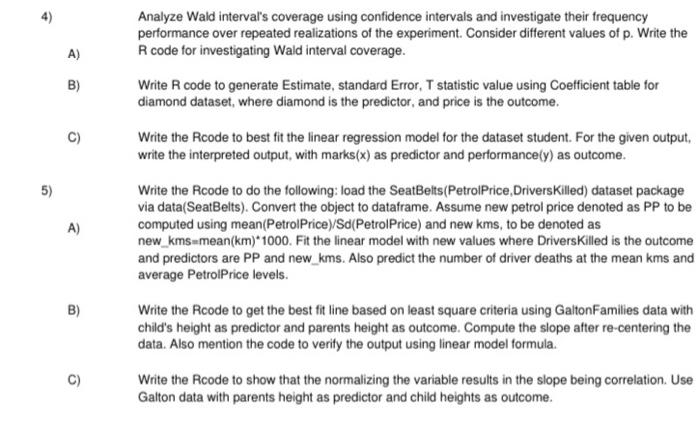
Analyze Wald interval's coverage using confidence intervals and investigate their frequency performance over repeated realizations of the experiment. Consider different values of p. Write the R code for investigating Wald interval coverage. Write R code to generate Estimate, standard Error, T statistic value using Coefficient table for diamond dataset, where diamond is the predictor, and price is the outcome. Write the Rcode to best fit the linear regression model for the dataset student. For the given output, write the interpreted output, with marks (x) as predictor and performance( (y) as outcome. Write the Rcode to do the following: load the SeatBelts(PetrolPrice,DriversKilled) dataset package via data(SeatBelts). Convert the object to dataframe. Assume new petrol price denoted as PP to be computed using mean(PetrolPrice)/Sd(PetrolPrice) and new kms, to be denoted as new_ kms= mean (km)1000. Fit the linear model with new values where DriversKilled is the outcome and predictors are PP and new_ kms. Also predict the number of driver deaths at the mean kms and average PetrolPrice levels. Write the Rcode to get the best fit line based on least square criteria using GaltonFamilies data with child's height as predictor and parents height as outcome. Compute the slope after re-centering the data. Also mention the code to verify the output using linear model formula. Write the Rcode to show that the normalizing the variable results in the slope being correlation. Use Galton data with parents height as predictor and child heights as outcome
Step by Step Solution
There are 3 Steps involved in it

Get step-by-step solutions from verified subject matter experts