

Question: Analyze Your Sample Discuss how the regional sample created is or is not reflective of the national market. Compare and contrast your sample with the
- Analyze Your Sample
- Discuss how the regional sample created is or is not reflective of the national market.
- Compare and contrast your sample with the population using the National Summary Statistics and Graphs Real Estate Data PDF document.
- Explain how you have made sure that the sample is random.
- Explain your methods to get a truly random sample.Observe patterns
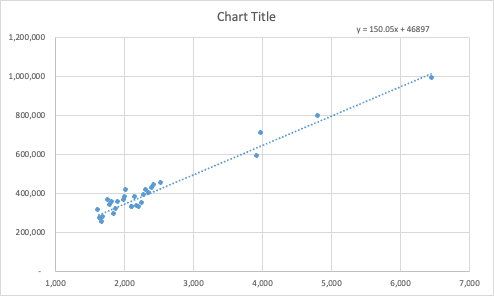
- Answer the following questions based on the scatterplot:
- Define x and y. Which variable is useful for making predictions?
- Is there an association between x and y? Describe the association you see in the scatter plot.
- What do you see as the shape (linear or nonlinear)?
- If you had a 1,800 square foot house, based on the regression equation in the graph, what price would you choose to list at?
- Do you see any potential outliers in the scatterplot?
- Why do you think the outliers appeared in the scatterplot you generated?
- What do they represent?
- Answer the following questions based on the scatterplot:
- Explain your methods to get a truly random sample.Observe patterns
- Discuss how the regional sample created is or is not reflective of the national market.
\f
Step by Step Solution
There are 3 Steps involved in it
1 Expert Approved Answer
Step: 1 Unlock

Question Has Been Solved by an Expert!
Get step-by-step solutions from verified subject matter experts
Step: 2 Unlock
Step: 3 Unlock