

Question: Analyzed grade point State University recently randomly sampled ten students and analyzed grade point average (GPA) and number of hours worked off-campus per week. The
Analyzed grade point
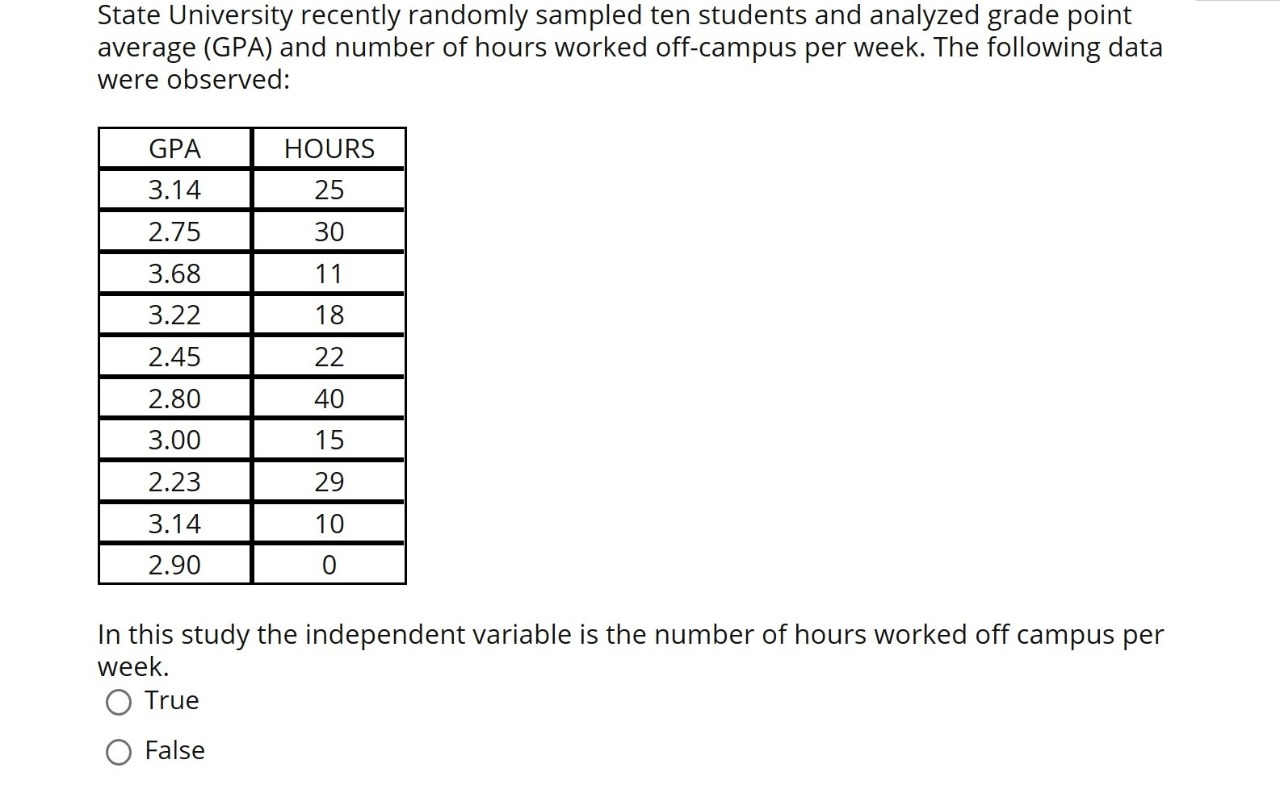
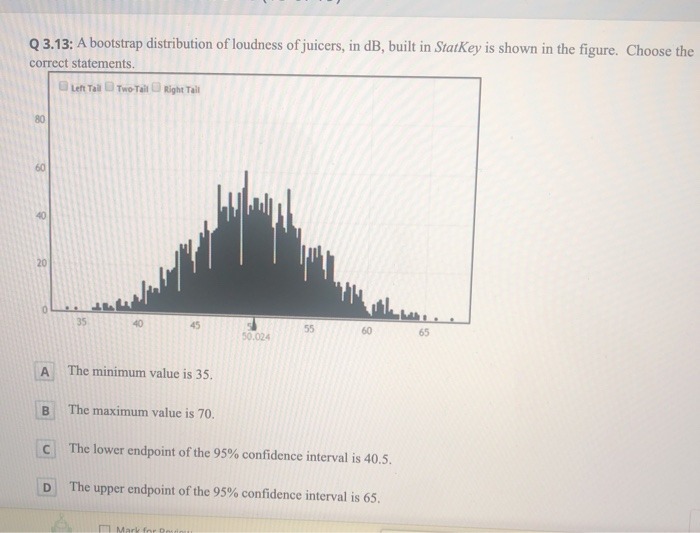
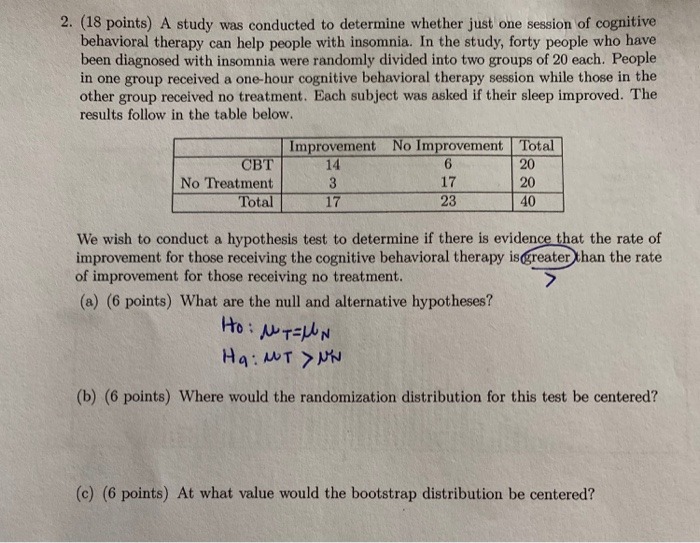
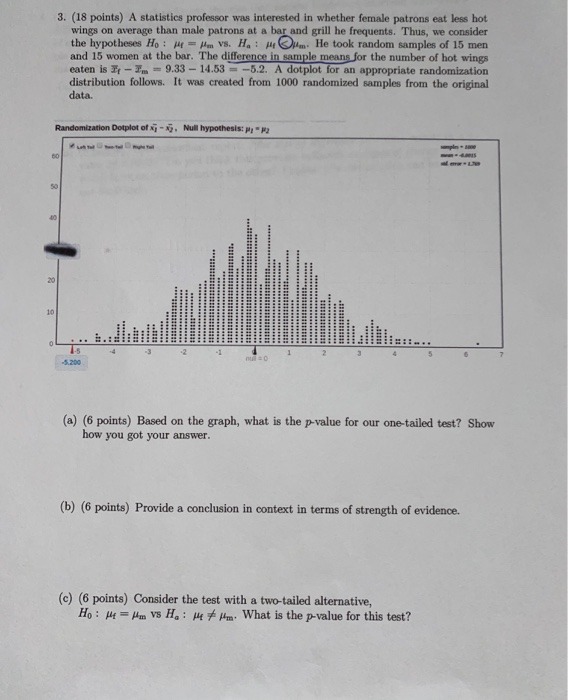
State University recently randomly sampled ten students and analyzed grade point average (GPA) and number of hours worked off-campus per week. The following data were observed: LO In this study the independent variable is the number of hours worked off campus per week. 0 True 0 False Q 3.13: A bootstrap distribution of loudness of juicers, in dB, built in Starkey is shown in the figure. Choose the correct statements. Left Tall Two-Tail Right Tail 60 40 20 40 45 55 60 65 50.024 A The minimum value is 35. B The maximum value is 70. C The lower endpoint of the 95% confidence interval is 40.5. D The upper endpoint of the 95% confidence interval is 65.2. (18 points) A study was conducted to determine whether just one session of cognitive behavioral therapy can help people with insomnia. In the study, forty people who have been diagnosed with insomnia were randomly divided into two groups of 20 each. People in one group received a one-hour cognitive behavioral therapy session while those in the other group received no treatment. Each subject was asked if their sleep improved. The results follow in the table below. Improvement No Improvement Total CBT 14 6 20 No Treatment 3 17 20 Total 17 23 40 We wish to conduct a hypothesis test to determine if there is evidence that the rate of improvement for those receiving the cognitive behavioral therapy isgreater than the rate of improvement for those receiving no treatment. (a) (6 points) What are the null and alternative hypotheses? HO : NUT = JUN Ha : MT > NN (b) (6 points) Where would the randomization distribution for this test be centered? (c) (6 points) At what value would the bootstrap distribution be centered?3. (18 points) A statistics professor was interested in whether female patrons eat less hot wings on average than male patrons at a bar and grill he frequents. Thus, we consider the hypotheses Ho : At = Am VS. H. : My Cum. He took random samples of 15 men and 15 women at the bar. The difference in sample means for the number of hot wings eaten is It - Im = 9.33 - 14.53 = -5.2. A dotplot for an appropriate randomization distribution follows. It was created from 1000 randomized samples from the original data. Randomization Dotplot of x; - $7 . Null hypothesis: pp = F2 20 1-5 1 2 -5.209 (a) (6 points) Based on the graph, what is the p-value for our one-tailed test? Show how you got your answer. (b) (6 points) Provide a conclusion in context in terms of strength of evidence. (c) (6 points) Consider the test with a two-tailed alternative, Ho : My = Am VS H. : My / Hm. What is the p-value for this test
Step by Step Solution
There are 3 Steps involved in it

Get step-by-step solutions from verified subject matter experts