

Question: Analyzing Financial Risk Presented below are selected financial data from the Medtronic 2018 annual report. Using the ratio definitions from Exhibit 4.6, calculate the following
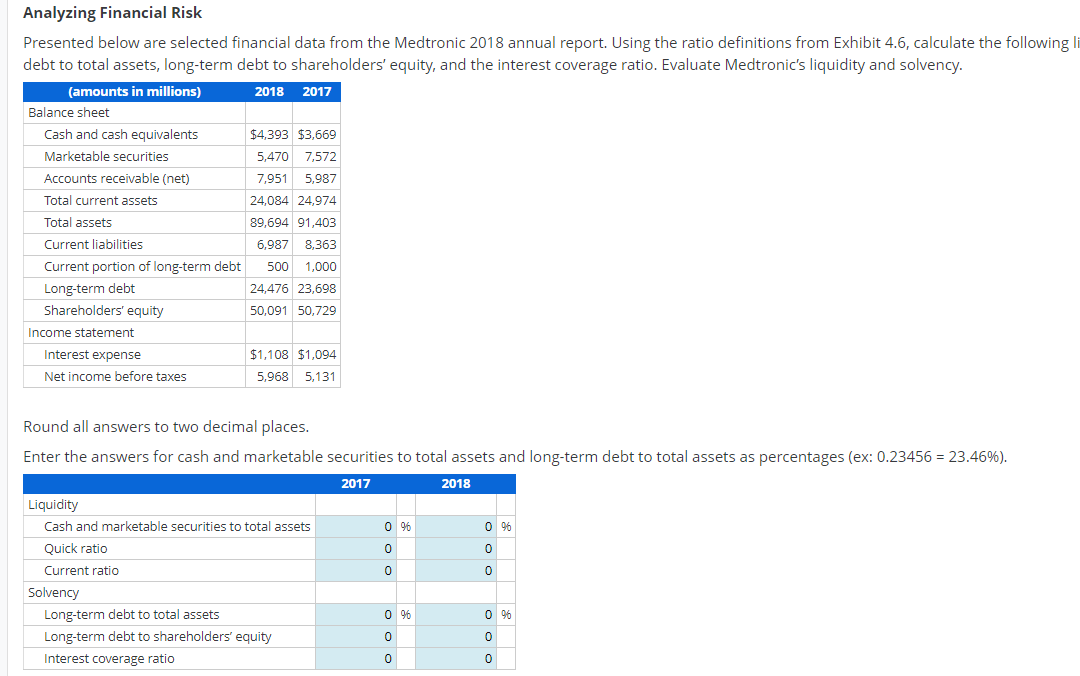
Analyzing Financial Risk Presented below are selected financial data from the Medtronic 2018 annual report. Using the ratio definitions from Exhibit 4.6, calculate the following li debt to total assets, long-term debt to shareholders' equity, and the interest coverage ratio. Evaluate Medtronic's liquidity and solvency. (amounts in millions) 2018 2017 Balance sheet Cash and cash equivalents $4,393 $3,669 Marketable securities 5,470 7.572 Accounts receivable (net) 7,951 5,987 Total current assets 24,084 24,974 Total assets 89,694 91,403 Current liabilities 6,987 8,363 Current portion of long-term debt 500 1,000 Long-term debt 24,476 23,698 Shareholders' equity 50,091 50,729 Income statement Interest expense $1,108 $1,094 Net income before taxes 5,968 5.131 Round all answers to two decimal places. Enter the answers for cash and marketable securities to total assets and long-term debt to total assets as percentages (ex: 0.23456 = 23.46%). 2017 2018 Liquidity Cash and marketable securities to total assets 096 096 Quick ratio 0 0 Current ratio 0 0 Solvency Long-term debt to total assets 0 96 096 Long-term debt to shareholders' equity 0 0 Interest coverage ratio 0 0
Step by Step Solution
There are 3 Steps involved in it

Get step-by-step solutions from verified subject matter experts