

Question: Analyzing Financial Risk. Presented below are summary financial data from the Boeing Company annual report. 2015 2014 (amounts in millions) Balance sheet Cash and cash
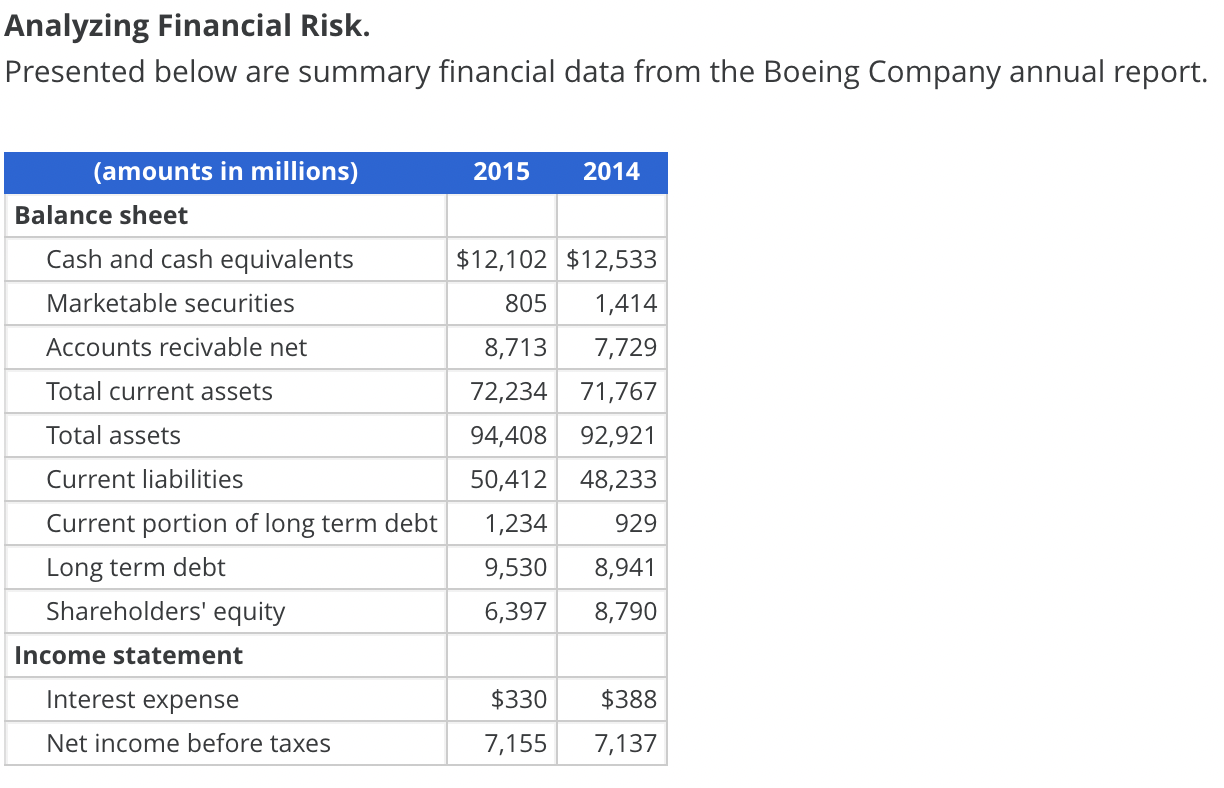
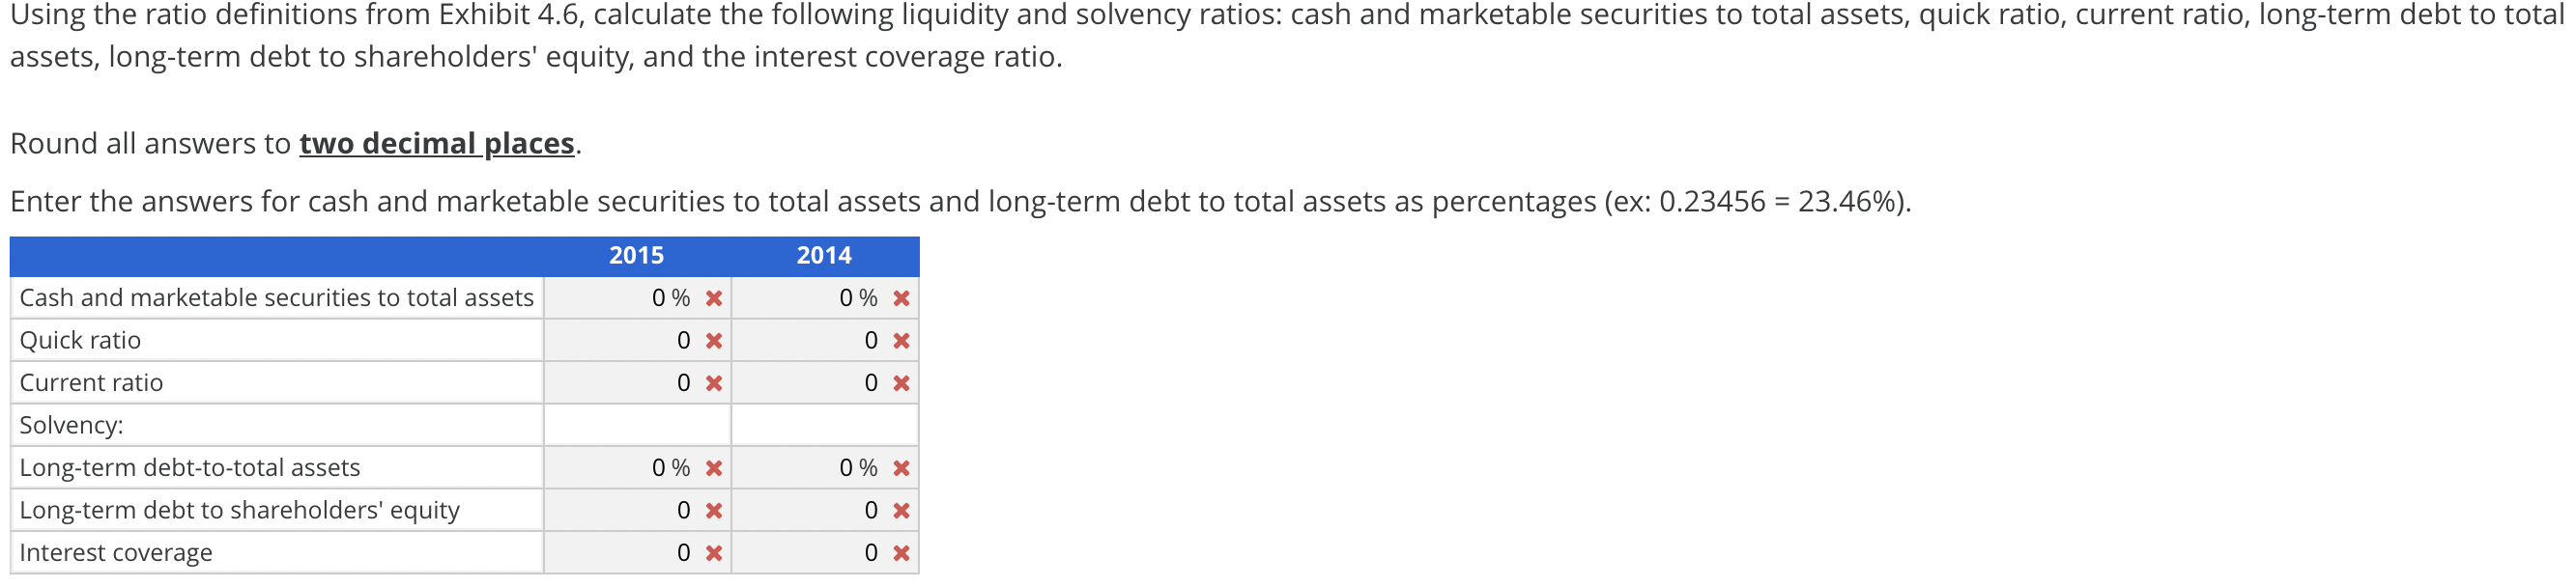
Analyzing Financial Risk. Presented below are summary financial data from the Boeing Company annual report. 2015 2014 (amounts in millions) Balance sheet Cash and cash equivalents Marketable securities Accounts recivable net Total current assets $12,102 $12,533 805 1,414 8,713 7,729 72,234 71,767 94,408 92,921 50,412 48,233 1,234 929 Total assets Current liabilities Current portion of long term debt Long term debt Shareholders' equity 9,530 6,397 8,941 8,790 Income statement Interest expense $330 $388 Net income before taxes 7,155 7,137 Using the ratio definitions from Exhibit 4.6, calculate the following liquidity and solvency ratios: cash and marketable securities to total assets, quick ratio, current ratio, long-term debt to total assets, long-term debt to shareholders' equity, and the interest coverage ratio. Round all answers to two decimal places. Enter the answers for cash and marketable securities to total assets and long-term debt to total assets as percentages (ex: 0.23456 = 23.46%). 2015 2014 0 % x 0 % X Cash and marketable securities to total assets Quick ratio 0 x 0 x Current ratio 0 x 0 X Solvency: Long-term debt-to-total assets Long-term debt to shareholders' equity O % x 0% x 0 x 0 x Interest coverage 0 x 0 x
Step by Step Solution
There are 3 Steps involved in it

Get step-by-step solutions from verified subject matter experts