

Question: Analyzing Financial Statement Data Presented below are summary financial data from the Bristol-Myers Squibb annual report. Using the ratio definitions from Exhibit 4.6, calculate the
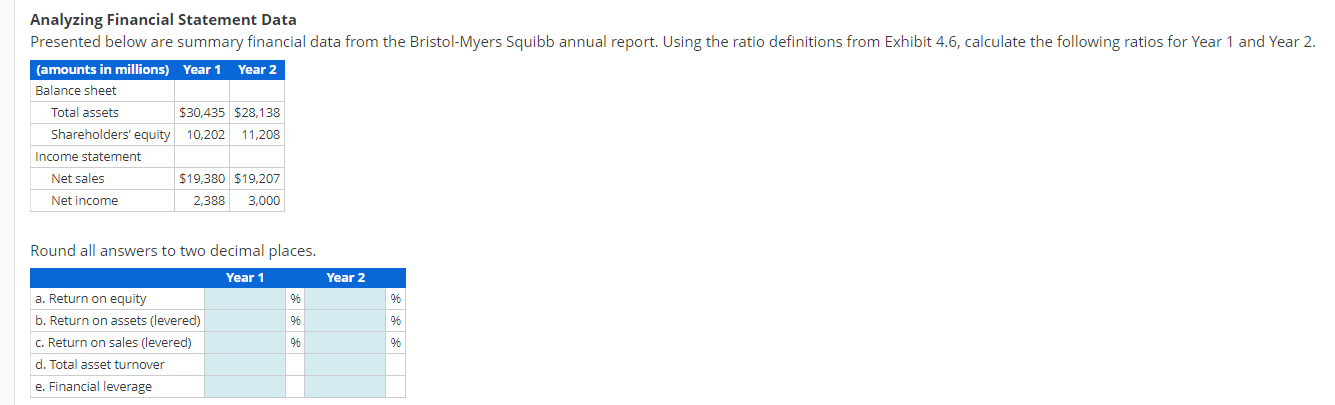
Analyzing Financial Statement Data Presented below are summary financial data from the Bristol-Myers Squibb annual report. Using the ratio definitions from Exhibit 4.6, calculate the following ratios for Year 1 and Year 2. (amounts in millions) Year 1 Year 2 Balance sheet Total assets $30,435 $28,138 Shareholders' equity 10,202 11,208 Income statement Net sales $19,380 $19,207 Net income 2,388 3,000 Round all answers to two decimal places. Year 1 Year 2 96 96 96 96 a. Return on equity b. Return on assets (levered) C. Return on sales (levered) d. Total asset turnover e. Financial leverage 96 96
Step by Step Solution
There are 3 Steps involved in it
1 Expert Approved Answer
Step: 1 Unlock

Question Has Been Solved by an Expert!
Get step-by-step solutions from verified subject matter experts
Step: 2 Unlock
Step: 3 Unlock