

Question: Analyzing, Forecasting, and Interpreting Both Income Statement and Balance Sheet Following are the income statements and balance sheets of Best Buy Co., Inc. Income Statement,
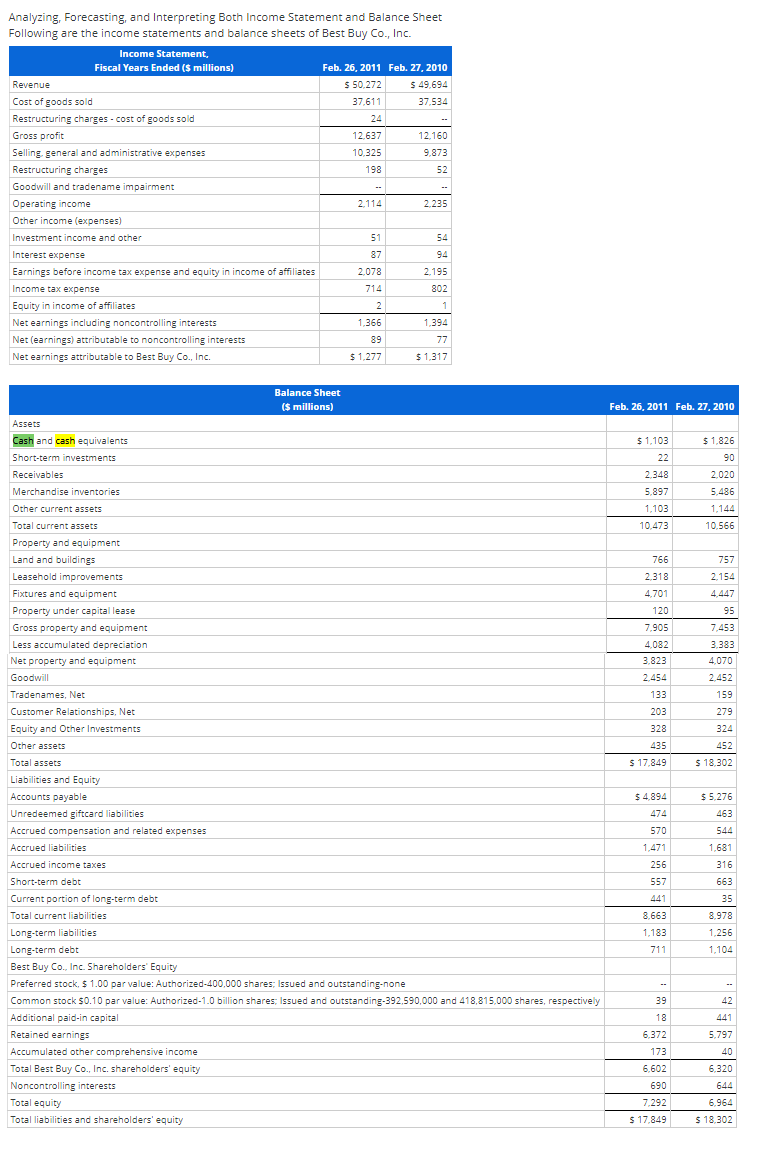
Analyzing, Forecasting, and Interpreting Both Income Statement and Balance Sheet Following are the income statements and balance sheets of Best Buy Co., Inc. Income Statement, Fiscal Years Ended ($ millions) Feb. 26, 2011 Feb. 27, 2010 Revenue $ 50.272 $ 49,694 Cost of goods sold 37.611 37,534 Restructuring charges.cost of goods sold Gross profit 12.637 12.160 Selling general and administrative expenses 10.325 9.873 Restructuring charges 198 52 Goodwill and tradename impairment Operating income 2.114 2.235 Other income (expenses) Investment income and other 51 54 Interest expense 87 Earnings before income tax expense and equity in income of affiliates 2.078 2.195 Income tax expense 714 802 Equity in income of affiliates 2 1 Net earnings including noncontrolling interests 1,366 1,394 Net (earnings) attributable to noncontrolling interests 89 77 Net earnings attributable to Best Buy Co., Inc. $ 1,277 $1,317 Balance Sheet ($ millions) Feb. 26, 2011 Feb. 27, 2010 Assets Cash and cash equivalents Short-term investments $1.826 90 $ 1.103 22 2.348 5.897 2.020 5,486 1.144 10.566 1,103 10,473 757 766 2.318 4.701 120 2.154 4.447 95 7.453 3.383 7,905 4,082 3.823 2.454 133 4.070 203 2,452 159 279 324 452 $ 18.302 328 435 $ 17,849 Receivables Merchandise inventories Other current assets Total current assets Property and equipment Land and buildings Leasehold improvements Fixtures and equipment Property under capital lease Gross property and equipment Less accumulated depreciation Net property and equipment Goodwill Tradenames, Net Customer Relationships, Net Equity and Other Investments Other assets Total assets Liabilities and Equity Accounts payable Unredeemed giftcard liabilities Accrued compensation and related expenses Accrued liabilities Accrued income taxes Short-term debt Current portion of long-term debt Total current liabilities Long-term liabilities Long-term debt Best Buy Co., Inc. Shareholders' Equity Preferred stock, $ 1.00 par value: Authorized-400,000 shares: Issued and outstanding-none Common stock 50.10 par value: Authorized-1.0 billion shares: Issued and outstanding-392,590,000 and 418,815,000 shares, respectively Additional paid.in capital Retained earnings Accumulated other comprehensive income Total Best Buy Co., Inc. shareholders' equity Noncontrolling interests Total equity Total liabilities and shareholders' equity $ 4.894 474 $ 5.276 463 544 570 1,471 1,681 316 256 557 441 8.663 663 35 8.978 1.256 1,104 1,183 711 .. 42 39 18 441 6,372 5.797 40 173 6,602 690 7.292 $ 17,849 6.320 644 6.964 $ 18.302 411 M 438 Relater to the news web DE DEREITOS RESE 12 i. Paciendo - SHARE S. Forset Bar.Bu 2012 locate the songs dora theoreta: balta spadta a pura laro : Fe 1441 Ana OSTS ST T. Bundles who rubar. Drych krst 2013 11. 10111 2301 . OH SIX LOS Pow.com 2 WIN 0.00 Kwa Analyzing, Forecasting, and Interpreting Both Income Statement and Balance Sheet Following are the income statements and balance sheets of Best Buy Co., Inc. Income Statement, Fiscal Years Ended ($ millions) Feb. 26, 2011 Feb. 27, 2010 Revenue $ 50.272 $ 49,694 Cost of goods sold 37.611 37,534 Restructuring charges.cost of goods sold Gross profit 12.637 12.160 Selling general and administrative expenses 10.325 9.873 Restructuring charges 198 52 Goodwill and tradename impairment Operating income 2.114 2.235 Other income (expenses) Investment income and other 51 54 Interest expense 87 Earnings before income tax expense and equity in income of affiliates 2.078 2.195 Income tax expense 714 802 Equity in income of affiliates 2 1 Net earnings including noncontrolling interests 1,366 1,394 Net (earnings) attributable to noncontrolling interests 89 77 Net earnings attributable to Best Buy Co., Inc. $ 1,277 $1,317 Balance Sheet ($ millions) Feb. 26, 2011 Feb. 27, 2010 Assets Cash and cash equivalents Short-term investments $1.826 90 $ 1.103 22 2.348 5.897 2.020 5,486 1.144 10.566 1,103 10,473 757 766 2.318 4.701 120 2.154 4.447 95 7.453 3.383 7,905 4,082 3.823 2.454 133 4.070 203 2,452 159 279 324 452 $ 18.302 328 435 $ 17,849 Receivables Merchandise inventories Other current assets Total current assets Property and equipment Land and buildings Leasehold improvements Fixtures and equipment Property under capital lease Gross property and equipment Less accumulated depreciation Net property and equipment Goodwill Tradenames, Net Customer Relationships, Net Equity and Other Investments Other assets Total assets Liabilities and Equity Accounts payable Unredeemed giftcard liabilities Accrued compensation and related expenses Accrued liabilities Accrued income taxes Short-term debt Current portion of long-term debt Total current liabilities Long-term liabilities Long-term debt Best Buy Co., Inc. Shareholders' Equity Preferred stock, $ 1.00 par value: Authorized-400,000 shares: Issued and outstanding-none Common stock 50.10 par value: Authorized-1.0 billion shares: Issued and outstanding-392,590,000 and 418,815,000 shares, respectively Additional paid.in capital Retained earnings Accumulated other comprehensive income Total Best Buy Co., Inc. shareholders' equity Noncontrolling interests Total equity Total liabilities and shareholders' equity $ 4.894 474 $ 5.276 463 544 570 1,471 1,681 316 256 557 441 8.663 663 35 8.978 1.256 1,104 1,183 711 .. 42 39 18 441 6,372 5.797 40 173 6,602 690 7.292 $ 17,849 6.320 644 6.964 $ 18.302 411 M 438 Relater to the news web DE DEREITOS RESE 12 i. Paciendo - SHARE S. Forset Bar.Bu 2012 locate the songs dora theoreta: balta spadta a pura laro : Fe 1441 Ana OSTS ST T. Bundles who rubar. Drych krst 2013 11. 10111 2301 . OH SIX LOS Pow.com 2 WIN 0.00 Kwa
Step by Step Solution
There are 3 Steps involved in it

Get step-by-step solutions from verified subject matter experts