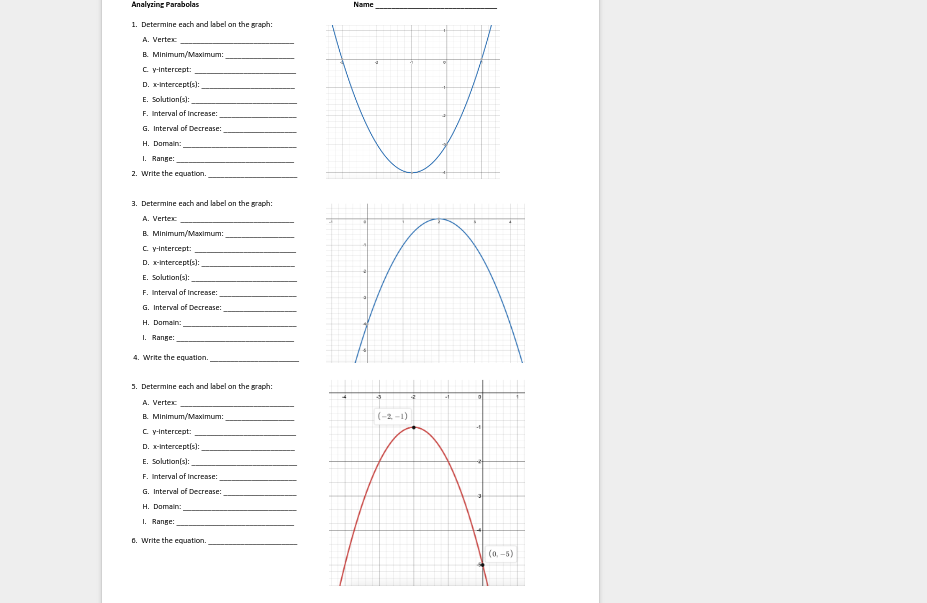
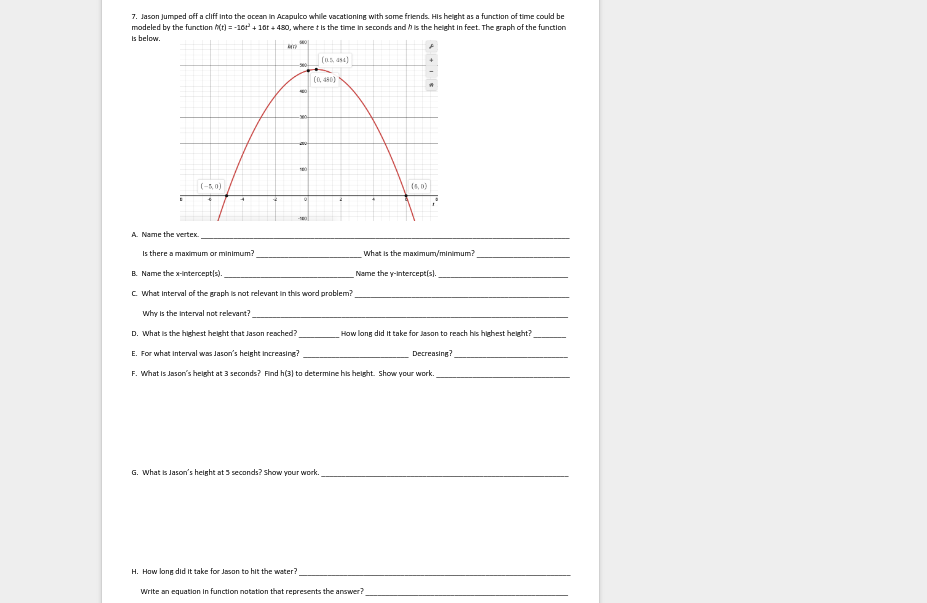
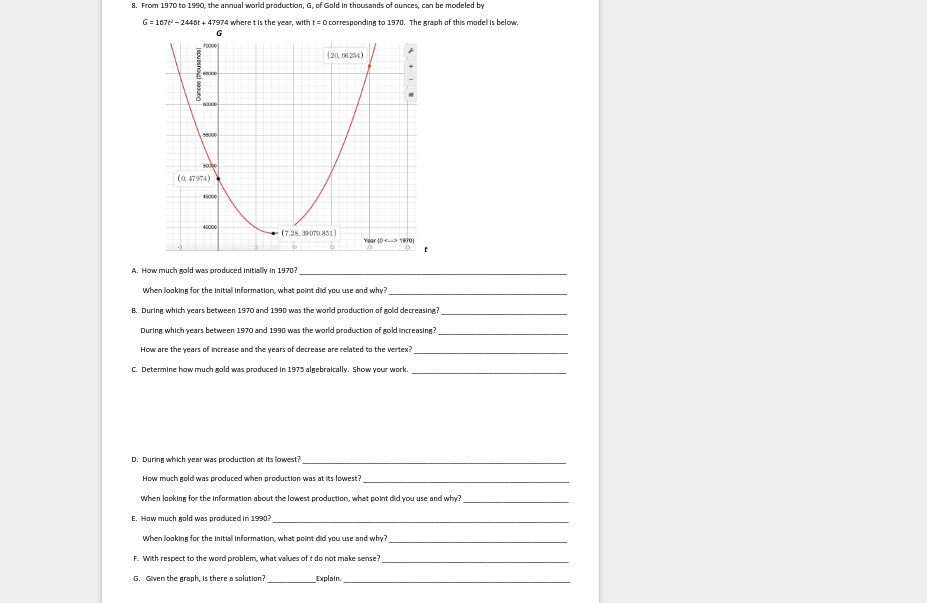
Question: Analyzing Parabolas Name _ 1. Determine each and label on the graph: A. Verter B. Minimum/Maximum: C. y-Intercept: D. X-Intercept(s]: E. Solution[s): F. Interval of

Analyzing Parabolas Name _ 1. Determine each andAnalyzing Parabolas Name _ 1. Determine each andAnalyzing Parabolas Name _ 1. Determine each and
Analyzing Parabolas Name _ 1. Determine each and label on the graph: A. Verter B. Minimum/Maximum: C. y-Intercept: D. X-Intercept(s]: E. Solution[s): F. Interval of Increase: G. Interval of Decrease: H. Domain: I. Range: 2. Write the equation. 3. Determine each and label on the graph: A. Verter B. Minimum/Maximum: C. y-Intercept: D. I-Interceptis]: E. Solution[s] F. Interval of Increase: G. Interval of Decrease: H. Domain: I. Range 4. Write the equation. 5. Determine each and label on the graph: A. Verter B. Minimum/Maximum: (-2-1) C. y-Intercept: D. X-Intercept(s]: E. Solution[s]: F. Interval of Increase: G. Interval of Decrease: H. Domain: . Range: D. Write the equation. (0, -5)7. Jason Jumped off a cliff into the ocean in Acapulco while vacationing with some friends. His height as a function of time could be modeled by the function ((t] = -lot + 10t + 480, where + Is the time in seconds and h is the height In feet. The graph of the function Is below. (-5, 0] (5, D) A. Name the vertex. Is there a maximum or minimum? What is the maximum/minimum? B. Name the *-intercept :). Name the y-Intercept[s]. C. What Interval of the graph is not relevant In this word problem? Why Is the Interval not relevant? D. What is the highest height that Jason reached? How long did it take for Jason to reach his highest height? E. For what Interval was Jason's height Increasing? Decreasing? F. What Is Jason's height at 3 seconds? Find h(3) to determine his height. Show your work. G. What is Jason's height at 3 seconds? show your work. H. How long did it take for Jason to hit the water? Write an equation In function notation that represents the answer?8. From 1970 to 1590, the annual world production, G, of Gold In thousands of ounces, can be modeled by G = 1070 - 2440t + 47974 where t Is the year, with t = 0 corresponding to 1970. The graph of this model is below. G (20. 66254) Qurcos [thousands 59000 (0, 47974) (7.28, 39070 851) t A. How much gold was produced Initially in 19707 When looking for the Initial Information, what point did you use and why? B. During which years between 1970 and 1990 was the world production of gold decreasing During which years between 1970 and 1990 was the world production of gold Increasing? How are the years of Increase and the years of decrease are related to the vertex?_ C. Determine how much gold was produced in 1973 algebraically. Show your work. D. During which year was production at Its lowest? How much gold was produced when production was at it's lowest? When looking for the Information about the lowest production, what point did you use and why? E. How much gold was produced in 1990?_ When looking for the Initial Information, what point did you use and why? F. With respect to the word problem, what values of & do not make sense? G. Given the graph, Is there a solution? Explain._

Step by Step Solution

There are 3 Steps involved in it

1 Expert Approved Answer
Step: 1 Unlock blur-text-image
Question Has Been Solved by an Expert!

Get step-by-step solutions from verified subject matter experts

Step: 2 Unlock
Step: 3 Unlock

Students Have Also Explored These Related Mathematics Questions!