

Question: Analyzing the Data 3. Use the box plots to complete the five-number summary chart. (3 points: 1 point for each row of the chart) Minimum
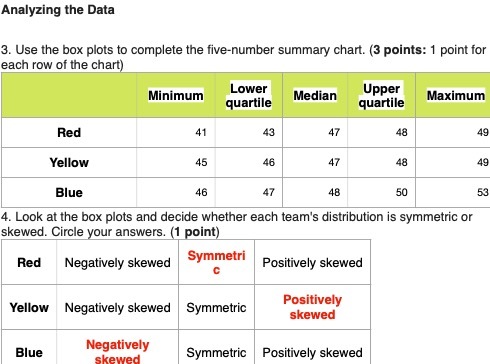
Analyzing the Data 3. Use the box plots to complete the five-number summary chart. (3 points: 1 point for each row of the chart) Minimum Lower Median Upper quartile quartile Maximum Red 41 43 47 48 49 Yellow 45 46 47 48 49 Blue 46 47 48 50 53 4. Look at the box plots and decide whether each team's distribution is symmetric or skewed. Circle your answers. (1 point) Red Negatively skewed Symmetri C Positively skewed Yellow Negatively skewed |Symmetric Positively skewed Blue Negatively skewed Symmetric Positively skewed
Step by Step Solution
There are 3 Steps involved in it
1 Expert Approved Answer
Step: 1 Unlock

Question Has Been Solved by an Expert!
Get step-by-step solutions from verified subject matter experts
Step: 2 Unlock
Step: 3 Unlock