Question: and 13 = = { ! In a study of systolic blood pressure (Y, SBP) among women, the body mass index (BMI) is recorded (continuous
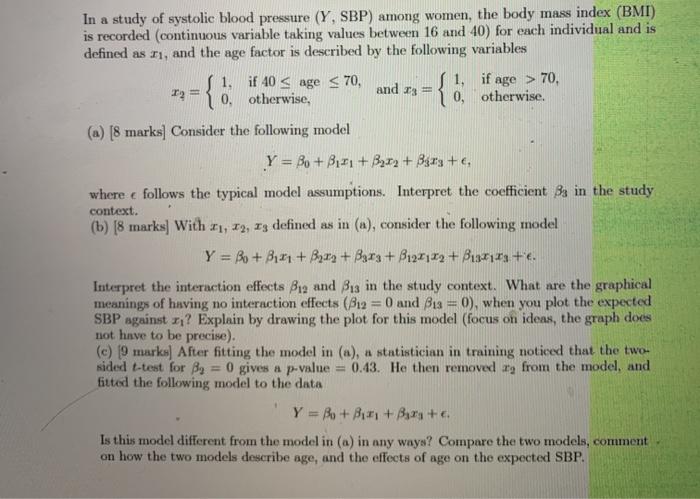
and 13 = = { ! In a study of systolic blood pressure (Y, SBP) among women, the body mass index (BMI) is recorded (continuous variable taking values between 16 and 40) for each individual and is defined as 11 and the age factor is described by the following variables 1. if 40 s age 70. re 0 otherwise, 0, otherwise. (a) (8 marks] Consider the following model Y = Bo + 371 +3912 + Bas + where e follows the typical model assumptions. Interpret the coefficient Bs in the study context. (b) (8 marks] With 11, 12, 13 defined as in (a), consider the following model Y = Bo + B121 + B272+ Bgr3+ B122112 + 12173 +e. Interpret the interaction effects Bio and B13 in the study context. What are the graphical meanings of having no interaction effects (B12 = 0 and Bus 0), when you plot the expected SBP against x? Explain by drawing the plot for this model (focus on ideas, the graph does not have to be precise). (c) 9 marks) After fitting the model in (a), a statistician in training noticed that the two sided t-test for By = 0 gives a p-value = 0.43. He then removed from the model, and fitted the following model to the data Y = Bo+B+By+e. Is this model different from the model in (a) in any ways? Compare the two models, comment on how the two models describe age, and the effects of age on the expected SBP. and 13 = = { ! In a study of systolic blood pressure (Y, SBP) among women, the body mass index (BMI) is recorded (continuous variable taking values between 16 and 40) for each individual and is defined as 11 and the age factor is described by the following variables 1. if 40 s age 70. re 0 otherwise, 0, otherwise. (a) (8 marks] Consider the following model Y = Bo + 371 +3912 + Bas + where e follows the typical model assumptions. Interpret the coefficient Bs in the study context. (b) (8 marks] With 11, 12, 13 defined as in (a), consider the following model Y = Bo + B121 + B272+ Bgr3+ B122112 + 12173 +e. Interpret the interaction effects Bio and B13 in the study context. What are the graphical meanings of having no interaction effects (B12 = 0 and Bus 0), when you plot the expected SBP against x? Explain by drawing the plot for this model (focus on ideas, the graph does not have to be precise). (c) 9 marks) After fitting the model in (a), a statistician in training noticed that the two sided t-test for By = 0 gives a p-value = 0.43. He then removed from the model, and fitted the following model to the data Y = Bo+B+By+e. Is this model different from the model in (a) in any ways? Compare the two models, comment on how the two models describe age, and the effects of age on the expected SBP


