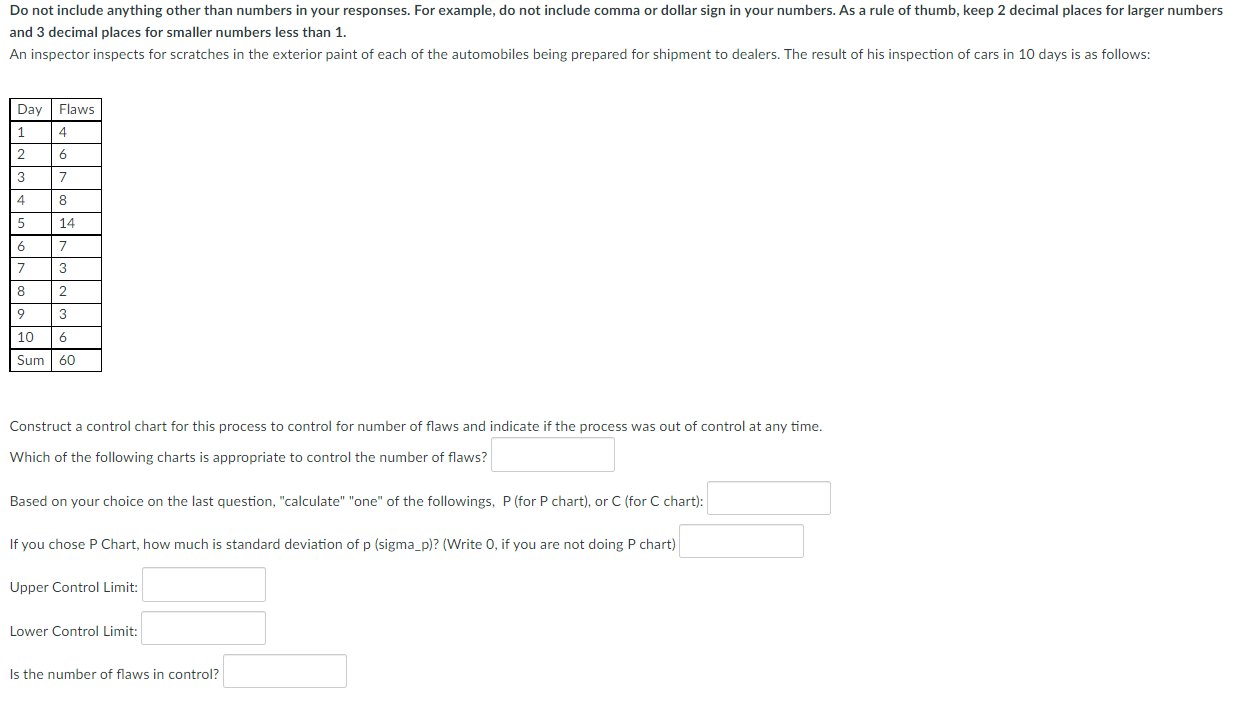
Question: and 3 decimal places for smaller numbers less than 1. Construct a control chart for this process to control for number of flaws and indicate

and 3 decimal places for smaller numbers less

and 3 decimal places for smaller numbers less than 1. Construct a control chart for this process to control for number of flaws and indicate if the process was out of control at any time. Which of the following charts is appropriate to control the number of flaws? Based on your choice on the last question, "calculate" "one" of the followings, P (for P chart), or C (for C chart): If you chose P Chart, how much is standard deviation of p (sigma_p)? (Write 0 , if you are not doing P chart) Upper Control Limit: Lower Control Limit: Is the number of flaws in control

Step by Step Solution

There are 3 Steps involved in it

1 Expert Approved Answer
Step: 1 Unlock blur-text-image
Question Has Been Solved by an Expert!

Get step-by-step solutions from verified subject matter experts

Step: 2 Unlock
Step: 3 Unlock

Students Have Also Explored These Related General Management Questions!