

Question: and parameters that describe them. A spreadsheet for Trance Electronics is provided. Suppose that the project manager of Trance Electronics has identified several uncertain
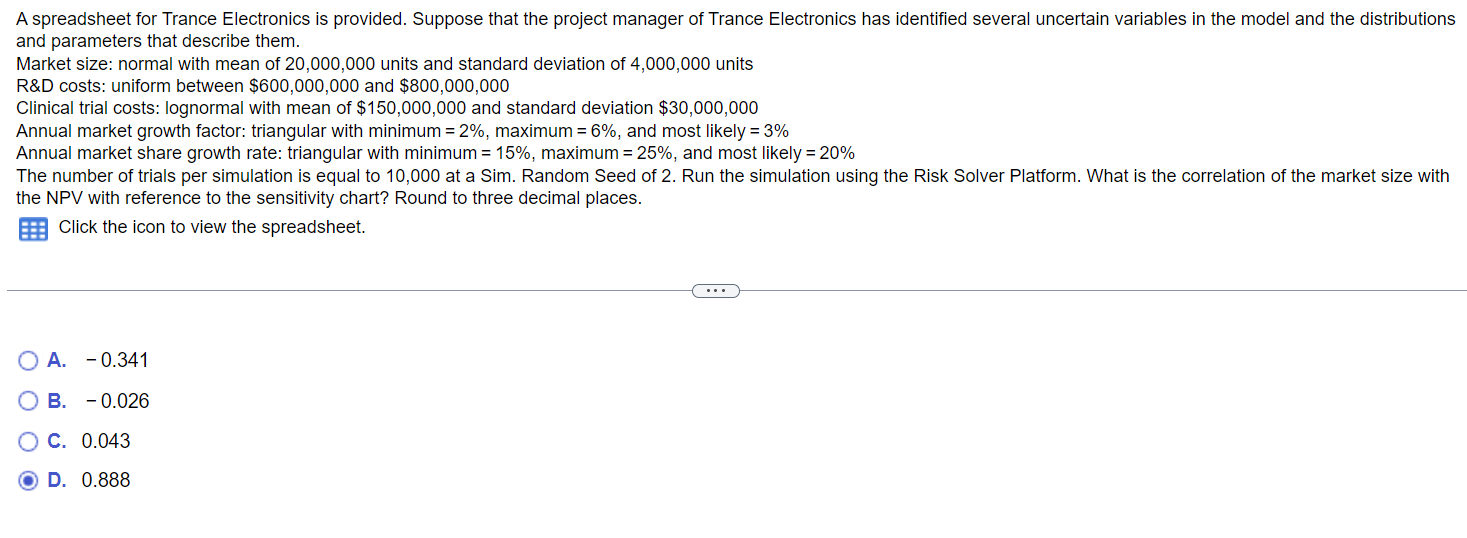
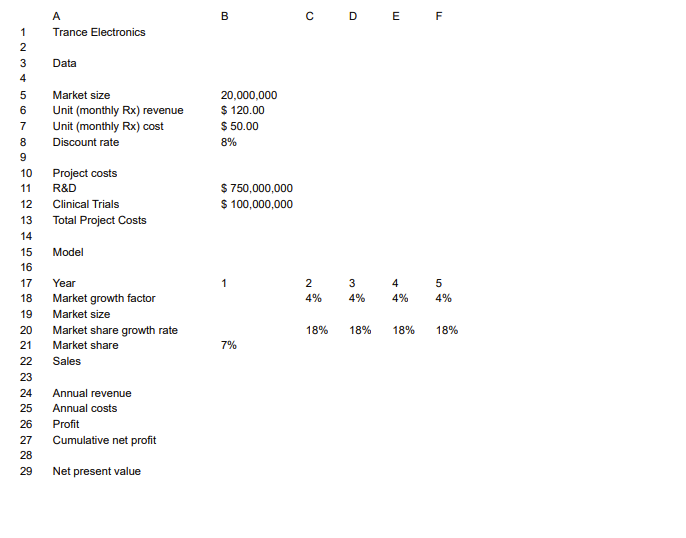
and parameters that describe them. A spreadsheet for Trance Electronics is provided. Suppose that the project manager of Trance Electronics has identified several uncertain variables in the model and the distributions Market size: normal with mean of 20,000,000 units and standard deviation of 4,000,000 units R&D costs: uniform between $600,000,000 and $800,000,000 Clinical trial costs: lognormal with mean of $150,000,000 and standard deviation $30,000,000 Annual market growth factor: triangular with minimum = 2%, maximum = 6%, and most likely = 3% Annual market share growth rate: triangular with minimum = 15%, maximum = 25%, and most likely = 20% The number of trials per simulation is equal to 10,000 at a Sim. Random Seed of 2. Run the simulation using the Risk Solver Platform. What is the correlation of the market size with the NPV with reference to the sensitivity chart? Round to three decimal places. Click the icon to view the spreadsheet. A. -0.341 B. -0.026 C. 0.043 D. 0.888 A B C D E F -23456789 2 = 23OTO 2222222222 28 Trance Electronics Data Market size Unit (monthly Rx) revenue Unit (monthly Rx) cost Discount rate 20,000,000 $ 120.00 $ 50.00 8% 14 15 10 Project costs 11 R&D 12 Clinical Trials 13 Total Project Costs Model 750,000,000 $ 100,000,000 16 17 Year 1 2 3 4 5 19 18 Market growth factor Market size 4% 4% 4% 4% 20 Market share growth rate 18% 18% 18% 18% 21 Market share Sales 7% 23 24 Annual revenue 25 Annual costs Profit 26 27 Cumulative net profit 29 Net present value
Step by Step Solution
There are 3 Steps involved in it

Get step-by-step solutions from verified subject matter experts