

Question: AND the p-value.. How would you do this in statcrunch Country A B D F G H Name Runner 1 Runner 2 Runner 3 Runner
 AND the p-value..
How would you do this in statcrunch
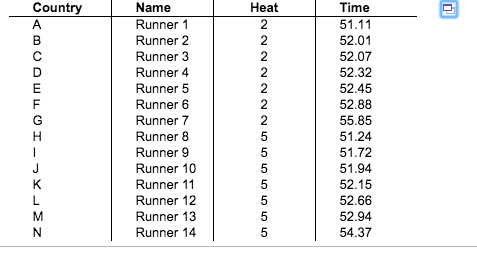
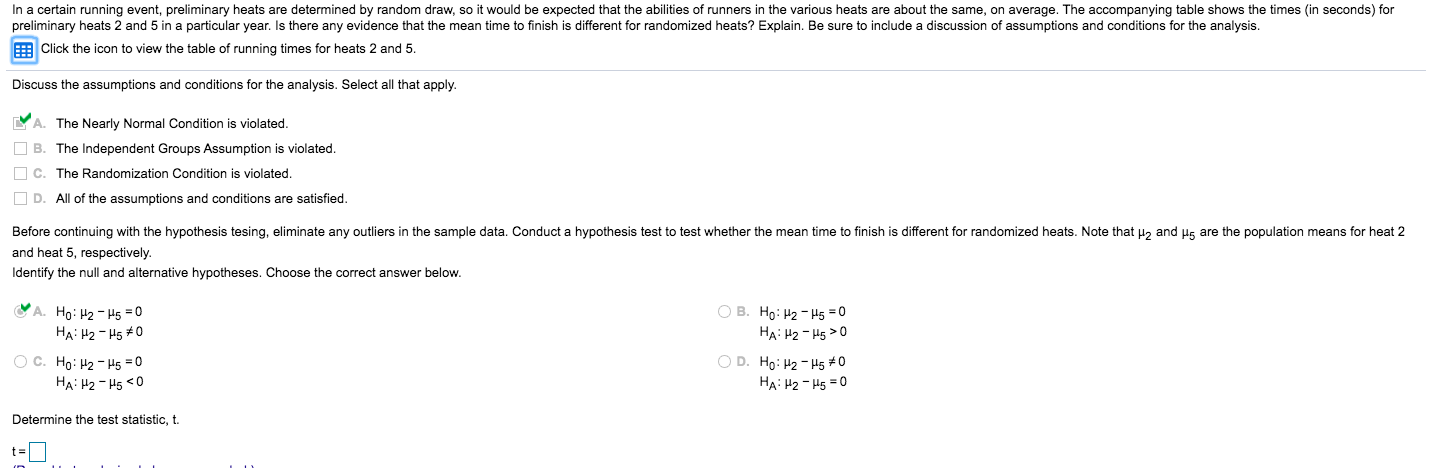
Country A B D F G H Name Runner 1 Runner 2 Runner 3 Runner 4 Runner 5 Runner 6 Runner 7 Runner 8 Runner 9 Runner 10 Runner 11 Runner 12 Runner 13 Runner 14 Heat 2 2 2 2 2 2 2 5 5 5 5 5 5 5 Time 51.11 52.01 52.07 52.32 52.45 52.88 55.85 51.24 51.72 51.94 52.15 52.66 52.94 54.37 - J K L M N In a certain running event, preliminary heats are determined by random draw, so it would be expected that the abilities of runners in the various heats are about the same, on average. The accompanying table shows the times (in seconds) for preliminary heats 2 and 5 in a particular year. Is there any evidence that the mean time to finish is different for randomized heats? Explain. Be sure to include a discussion of assumptions and conditions for the analysis. 3: Click the icon to view the table of running times for heats 2 and 5. Discuss the assumptions and conditions for the analysis. Select all that apply. A. The Nearly Normal Condition is violated B. The Independent Groups Assumption is violated. O C. The Randomization Condition is violated. D. All of the assumptions and conditions are satisfied. Before continuing with the hypothesis tesing, eliminate any outliers in the sample data. Conduct a hypothesis test to test whether the mean time to finish is different for randomized heats. Note that H2 and Ms are the population means for heat 2 and heat 5, respectively. Identify the null and alternative hypotheses. Choose the correct answer below. A. HOE H2-H5 = 0 HAH2 - H5 #0 OC. Ho: H2-H5 = 0 HA: H2-H5 0 OD. HO: H2-4570 HA: H2-H5 = 0 Determine the test statistic, t. ta Country A B D F G H Name Runner 1 Runner 2 Runner 3 Runner 4 Runner 5 Runner 6 Runner 7 Runner 8 Runner 9 Runner 10 Runner 11 Runner 12 Runner 13 Runner 14 Heat 2 2 2 2 2 2 2 5 5 5 5 5 5 5 Time 51.11 52.01 52.07 52.32 52.45 52.88 55.85 51.24 51.72 51.94 52.15 52.66 52.94 54.37 - J K L M N In a certain running event, preliminary heats are determined by random draw, so it would be expected that the abilities of runners in the various heats are about the same, on average. The accompanying table shows the times (in seconds) for preliminary heats 2 and 5 in a particular year. Is there any evidence that the mean time to finish is different for randomized heats? Explain. Be sure to include a discussion of assumptions and conditions for the analysis. 3: Click the icon to view the table of running times for heats 2 and 5. Discuss the assumptions and conditions for the analysis. Select all that apply. A. The Nearly Normal Condition is violated B. The Independent Groups Assumption is violated. O C. The Randomization Condition is violated. D. All of the assumptions and conditions are satisfied. Before continuing with the hypothesis tesing, eliminate any outliers in the sample data. Conduct a hypothesis test to test whether the mean time to finish is different for randomized heats. Note that H2 and Ms are the population means for heat 2 and heat 5, respectively. Identify the null and alternative hypotheses. Choose the correct answer below. A. HOE H2-H5 = 0 HAH2 - H5 #0 OC. Ho: H2-H5 = 0 HA: H2-H5 0 OD. HO: H2-4570 HA: H2-H5 = 0 Determine the test statistic, t. ta
Step by Step Solution
There are 3 Steps involved in it

Get step-by-step solutions from verified subject matter experts