

Question: and why? The school board is trying to evaluate a new math program introduced to second-graders in five elementary schools across the county this year.

and why?
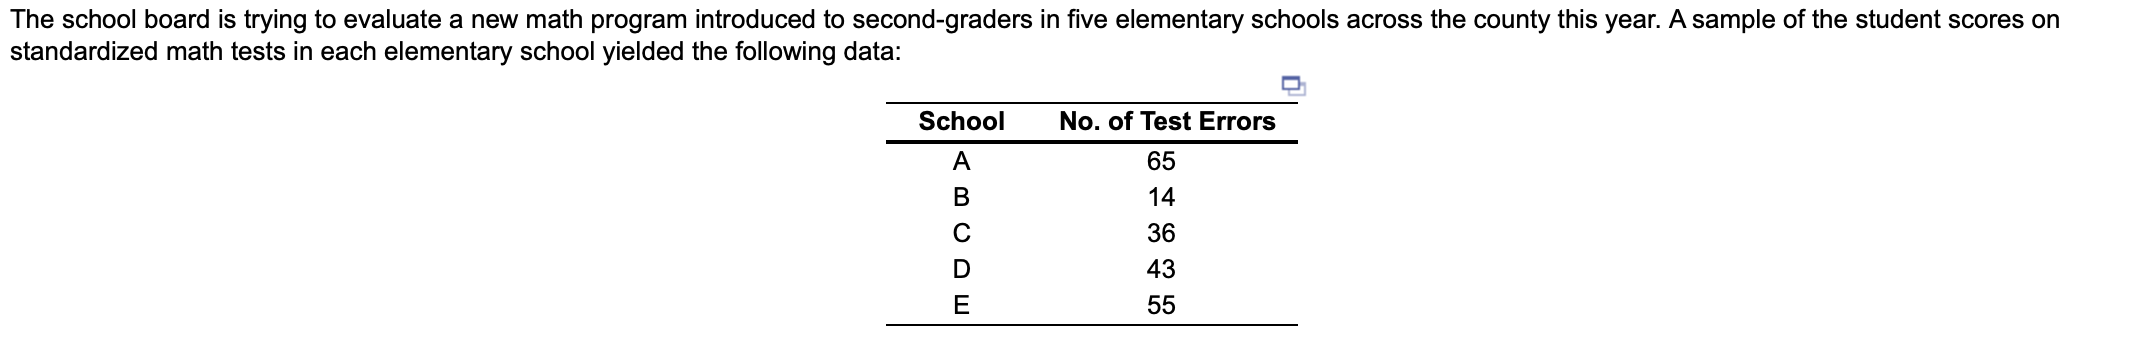
The school board is trying to evaluate a new math program introduced to second-graders in five elementary schools across the county this year. A sample of the student scores on standardized math tests in each elementary school yielded the following data: School A B No. of Test Errors 65 14 36 43 55 E For the test errors, the c-chart with control limits that contain 99.73% of the random variation in test scores is: UCL = errors (round your response to two decimal places). LCL = errors (round your response to two decimal places and if your answer is negative, enter this value as 0)Step by Step Solution
There are 3 Steps involved in it
1 Expert Approved Answer
Step: 1 Unlock

Question Has Been Solved by an Expert!
Get step-by-step solutions from verified subject matter experts
Step: 2 Unlock
Step: 3 Unlock