

Question: Angela is now going to evaluate a new salt process delivery system and wants to know if the upper and lower control limits at 3
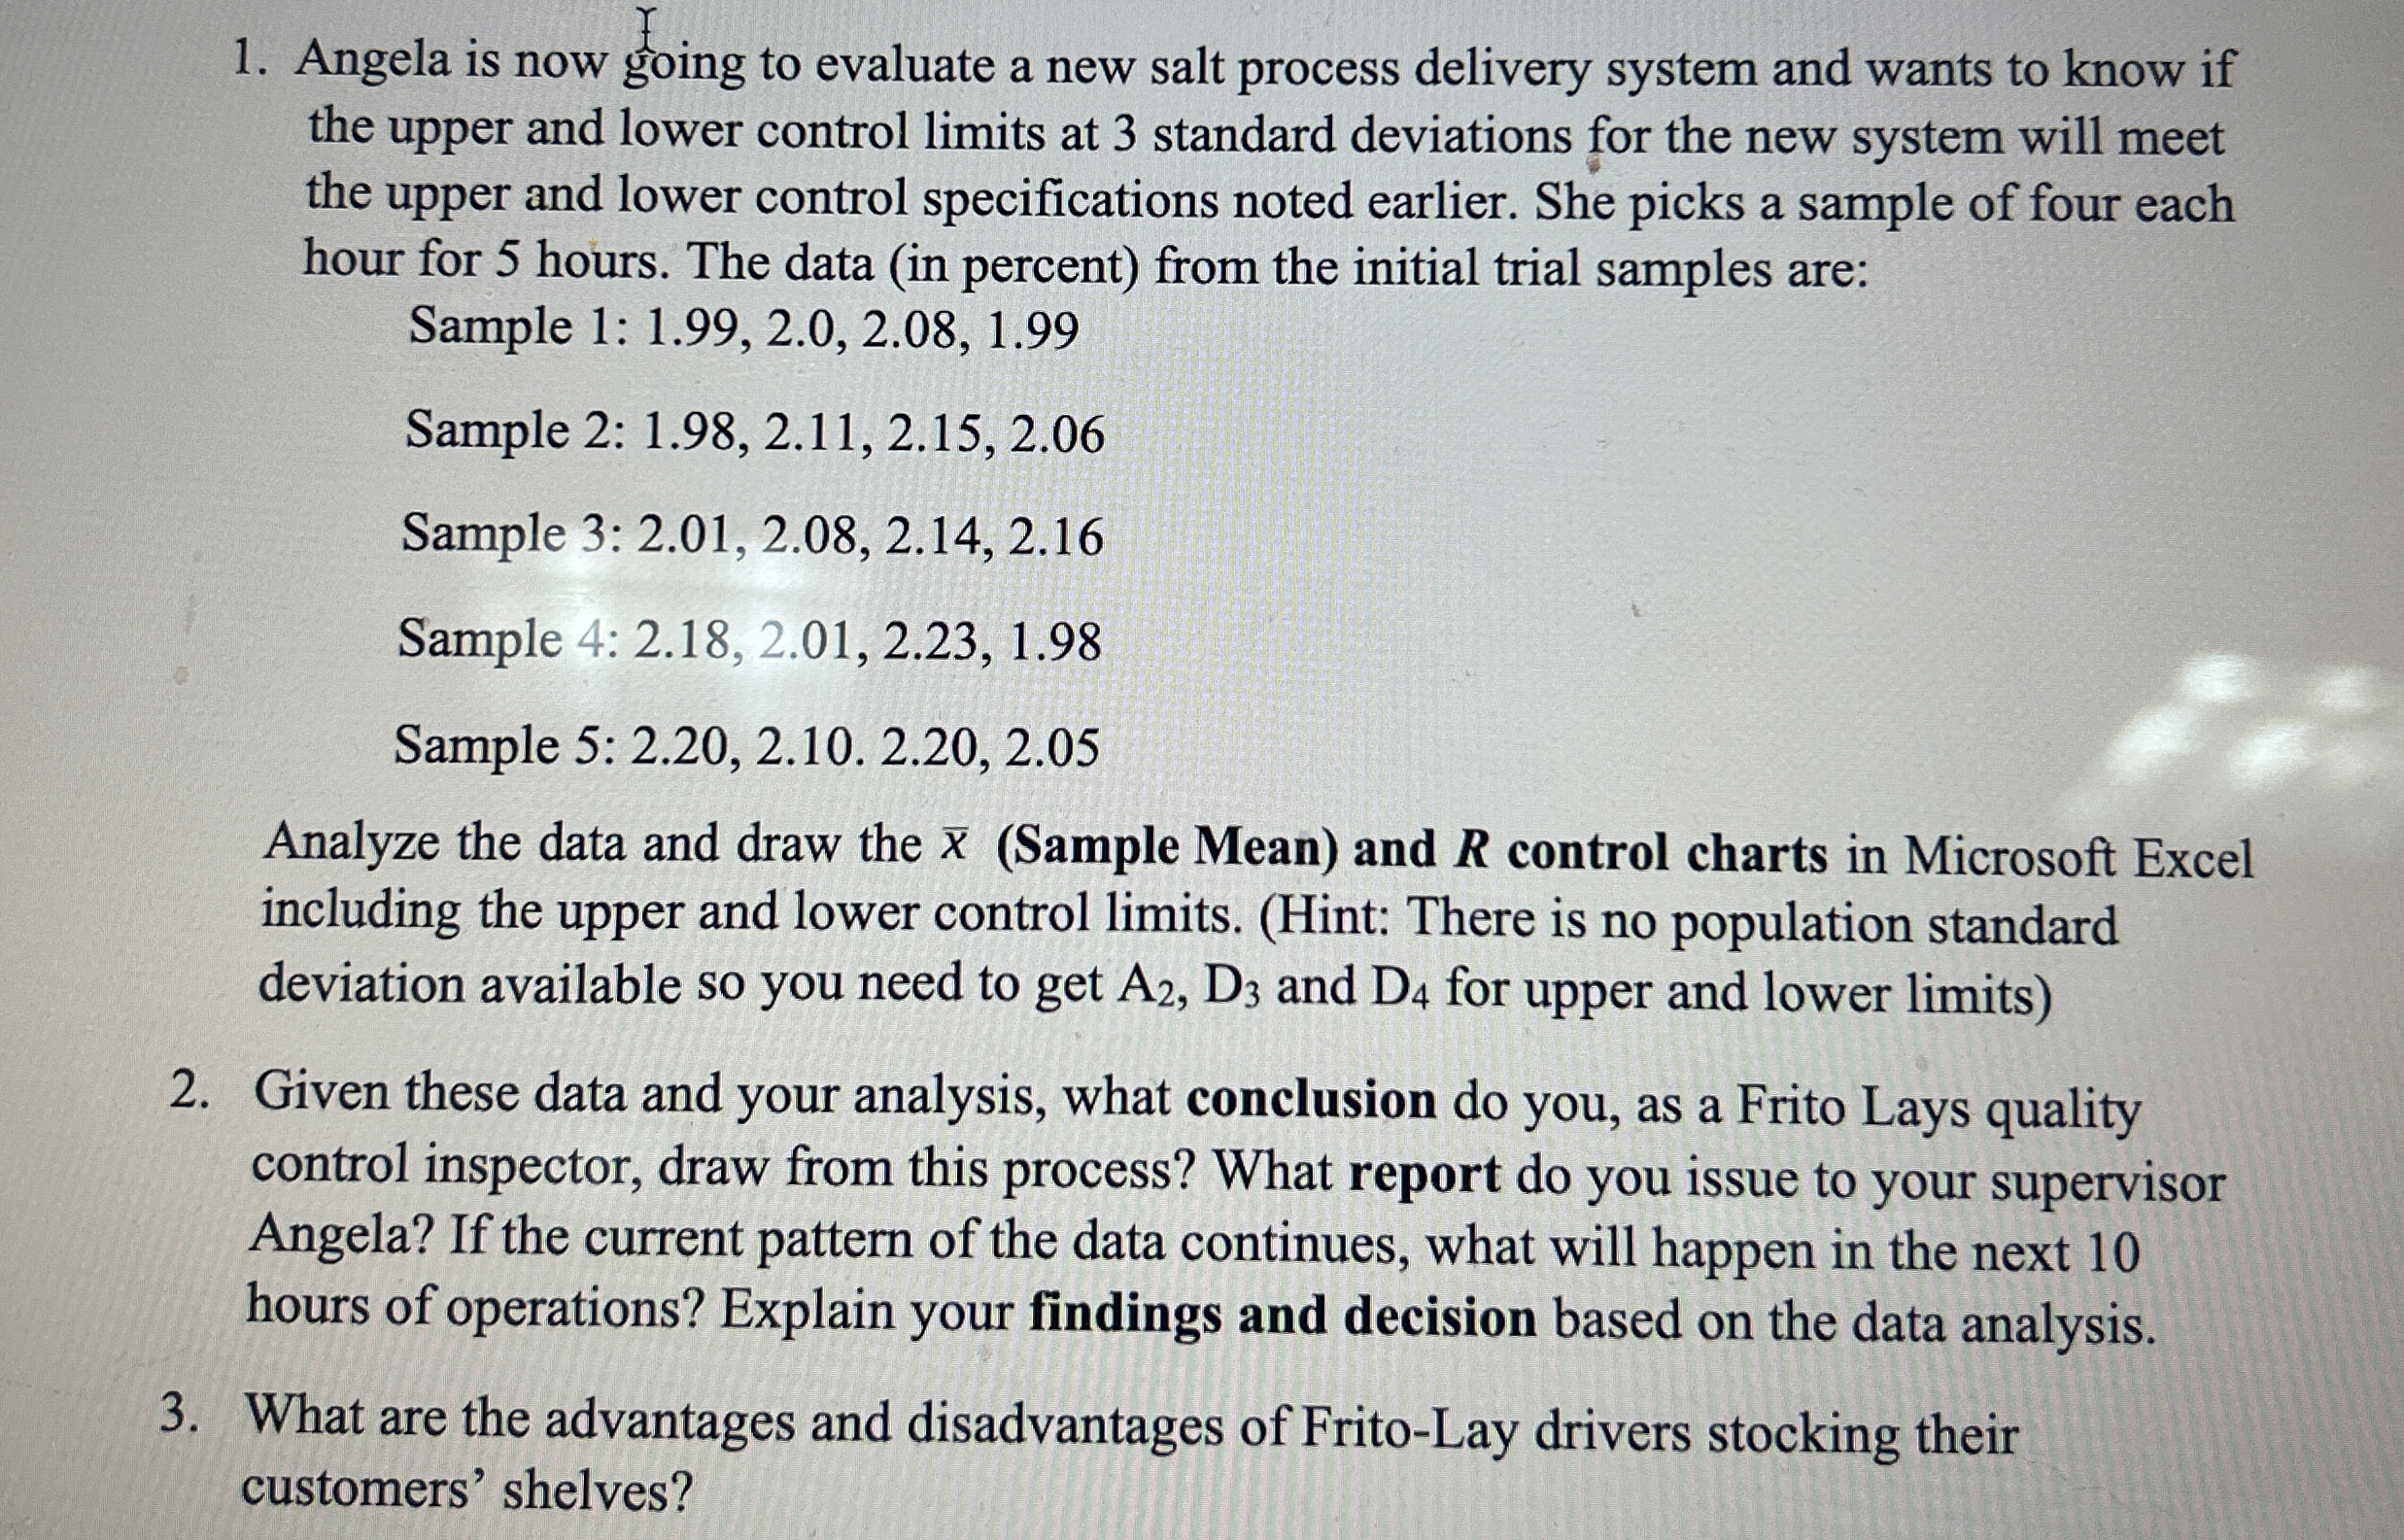
Angela is now going to evaluate a new salt process delivery system and wants to know if the upper and lower control limits at standard deviations for the new system will meet the upper and lower control specifications noted earlier. She picks a sample of four each hour for hours. The data in percent from the initial trial samples are:
Sample :
Sample :
Sample :
Sample :
Sample :
Analyze the data and draw the Sample Mean and control charts in Microsoft Excel including the upper and lower control limitsHint: There is no population standard deviation available so you need to get and for upper and lower limits
Given these data and your analysis, what conclusion do you, as a Frito Lays quality control inspector, draw from this process? What report do you issue to your supervisor Angela? If the current pattern of the data continues, what will happen in the next hours of operations? Explain your findings and decision based on the data analysis.
What are the advantages and disadvantages of FritoLay drivers stocking their customers' shelves?
Step by Step Solution
There are 3 Steps involved in it
1 Expert Approved Answer
Step: 1 Unlock

Question Has Been Solved by an Expert!
Get step-by-step solutions from verified subject matter experts
Step: 2 Unlock
Step: 3 Unlock