

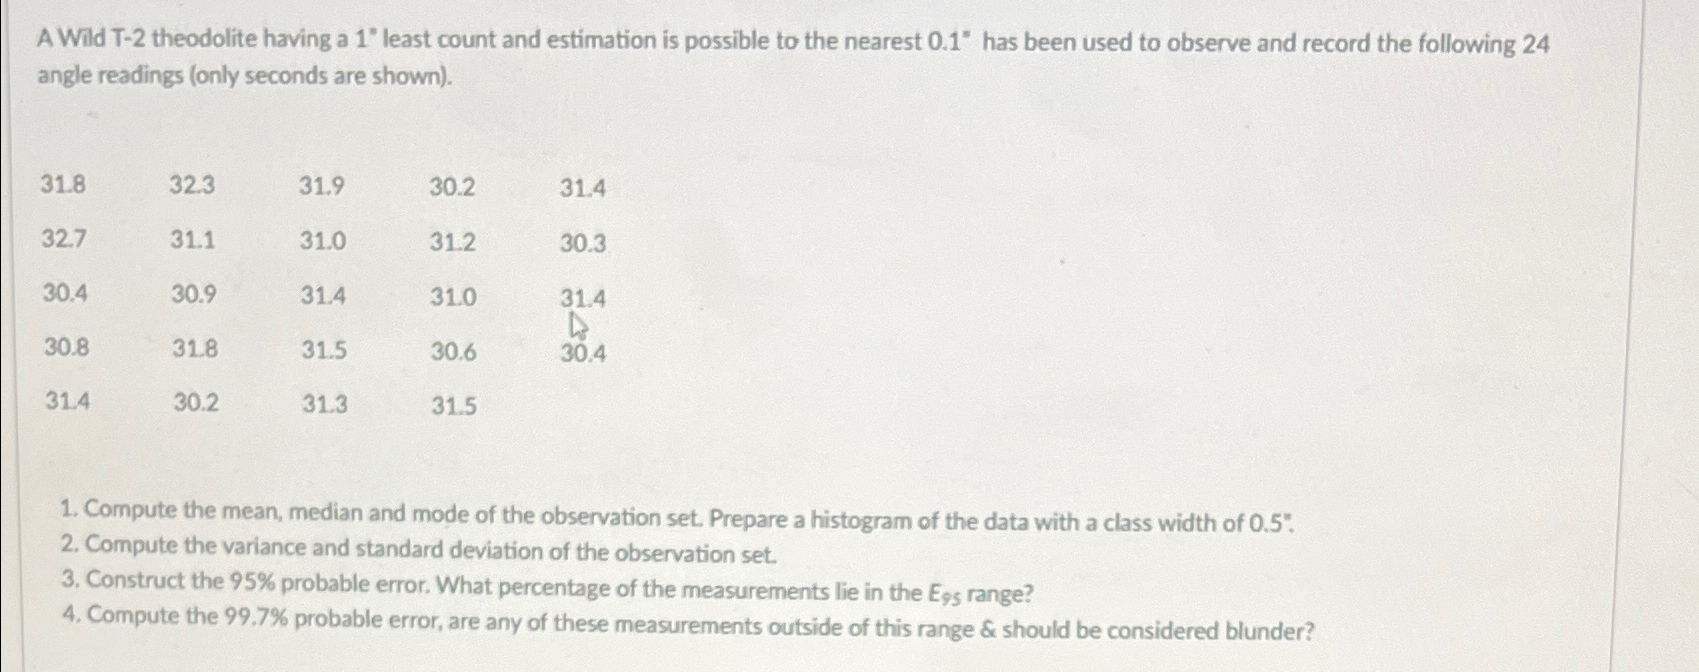
Question: angle readings ( only seconds are shown ) . table [ [ 3 1 . 8 , 3 2 . 3 , 3 1
angle readings only seconds are shown
table
Compute the mean, median and mode of the observation set. Prepare a histogram of the data with a class width of
Compute the variance and standard deviation of the observation set.
Construct the probable error. What percentage of the measurements lie in the E range?
Compute the probable error, are any of these measurements outside of this range & should be considered blunder?
Step by Step Solution
There are 3 Steps involved in it
1 Expert Approved Answer
Step: 1 Unlock

Question Has Been Solved by an Expert!
Get step-by-step solutions from verified subject matter experts
Step: 2 Unlock
Step: 3 Unlock