

Question: Animating the Plot We now define a function update _ plot ( i ) that updates all three graphs. The time at time step no
Animating the Plot
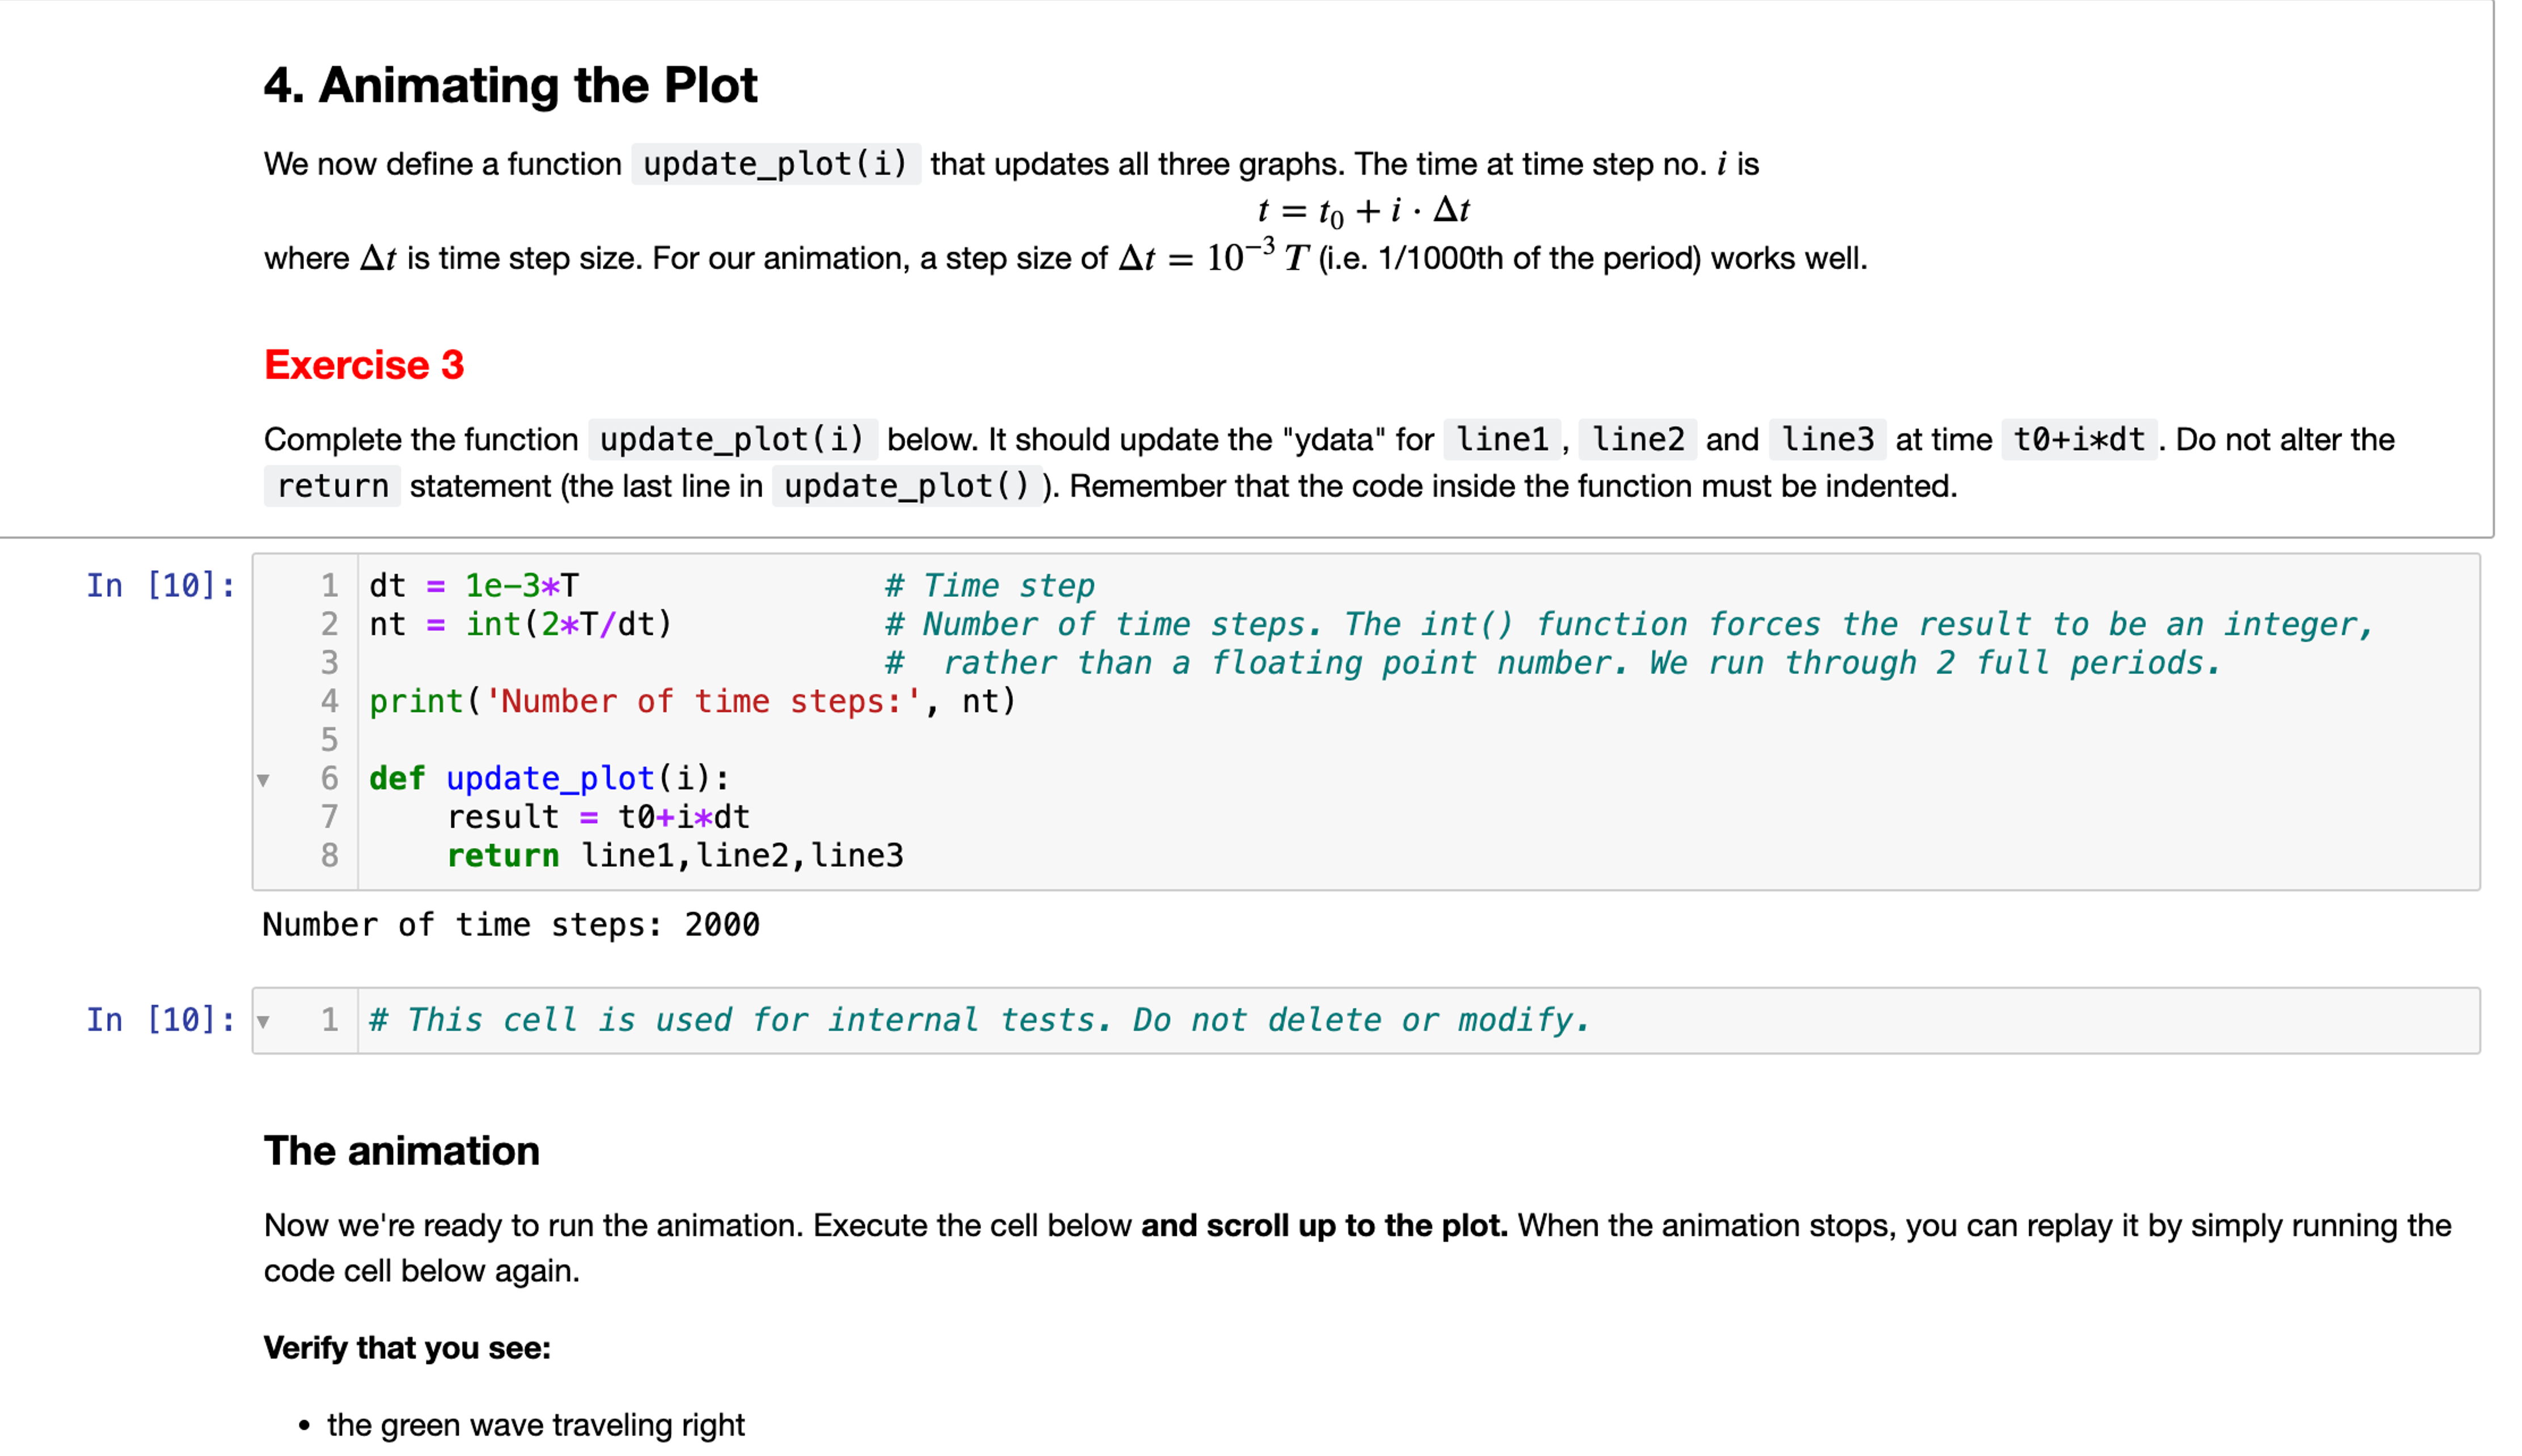
We now define a function updateplot i that updates all three graphs. The time at time step no is
where is time step size. For our animation, a step size of ie th of the period works well.
Exercise
Complete the function updateplot i below. It should update the "ydata" for line line and line at time tidt Do not alter the
return statement the last line in updateplot Remember that the code inside the function must be indented.
In :
Number of time steps:
In : # This cell is used for internal tests. Do not delete or modify.
The animation
Now we're ready to run the animation. Execute the cell below and scroll up to the plot. When the animation stops, you can replay it by simply running the
code cell below again.
Verify that you see:
the green wave traveling right
the animation code is below this and it is correct but im sure what i am doing wrong with this part in python
Step by Step Solution
There are 3 Steps involved in it
1 Expert Approved Answer
Step: 1 Unlock

Question Has Been Solved by an Expert!
Get step-by-step solutions from verified subject matter experts
Step: 2 Unlock
Step: 3 Unlock