

Question: Anled 3. On a spread sheet copy from the SBBI yearbook input the 15 annual returns for both large stocks and small stocks for each
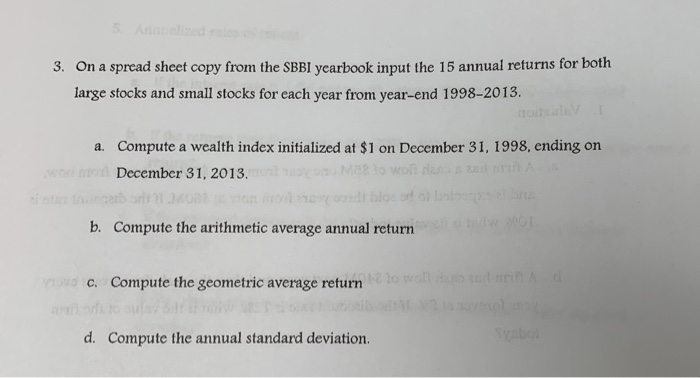
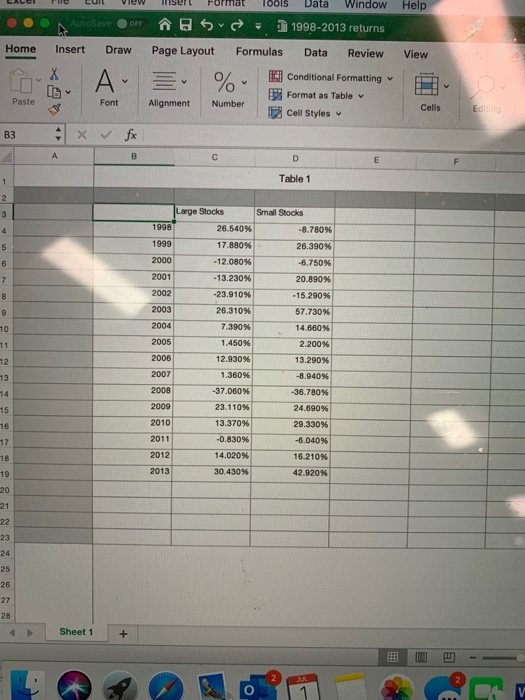
Anled 3. On a spread sheet copy from the SBBI yearbook input the 15 annual returns for both large stocks and small stocks for each year from year-end 1998-2013. goitsl a. Compute a wealth index initialized at $1 on December 31, 1998, ending owol da A on December 31, 2013. ndi bloe od o bsoo era b. Compute the arithmetic average annual return wl Compute the geometric average refurn ovoc. abor d. Compute the annual standard deviation. View Insert Format Tools Data Window Help AutoSave OFF 1998-2013 returns Home Insert Draw Page Layout Formulas Data Review View AV Conditional Formatting % Format as Table v Paste Font Alignment Number Cells Editing Cell Styles v fr X B3 A C D Table 1 1 2 Small Stocks Large Stocks 3 1998 26.540% -8.780 % 4 1999 17.880 % 26.390% -12.080 % 2000 -6.750% 6 2001 -13.230 % 20.890% 7 -23.910 % 2002 -15.290 % 2003 26.310 % 57.730 % 2004 14.660 % 7.390% 10 2005 1.450% 2.200 % 11 2006 12.930% 13.290% 12 2007 1.360% -8.940% 13 2008 -36.780 % -37.060 % 14 23.110 % 2009 24.690 % 15 2010 13.370% 29.330% 16 2011 -0.830 % -6.040 % 17 2012 14.020% 16.210 % 18 2013 30.430 % 42.920% 19 20 21 22 23 24 25 26 27 28 Sheet 1 + 2
Step by Step Solution
There are 3 Steps involved in it

Get step-by-step solutions from verified subject matter experts