

Question: $ Annotated Eib Honors Statistics, Mr Beckish, F x Statistics Textbook.pdf - Google Scholarship B Classroom M gmail Bell Sch drive.google.com/file/d/1S-kFJtPgu4_ueU-ex8NcNSIGM4cbmz/view Spring Paper College
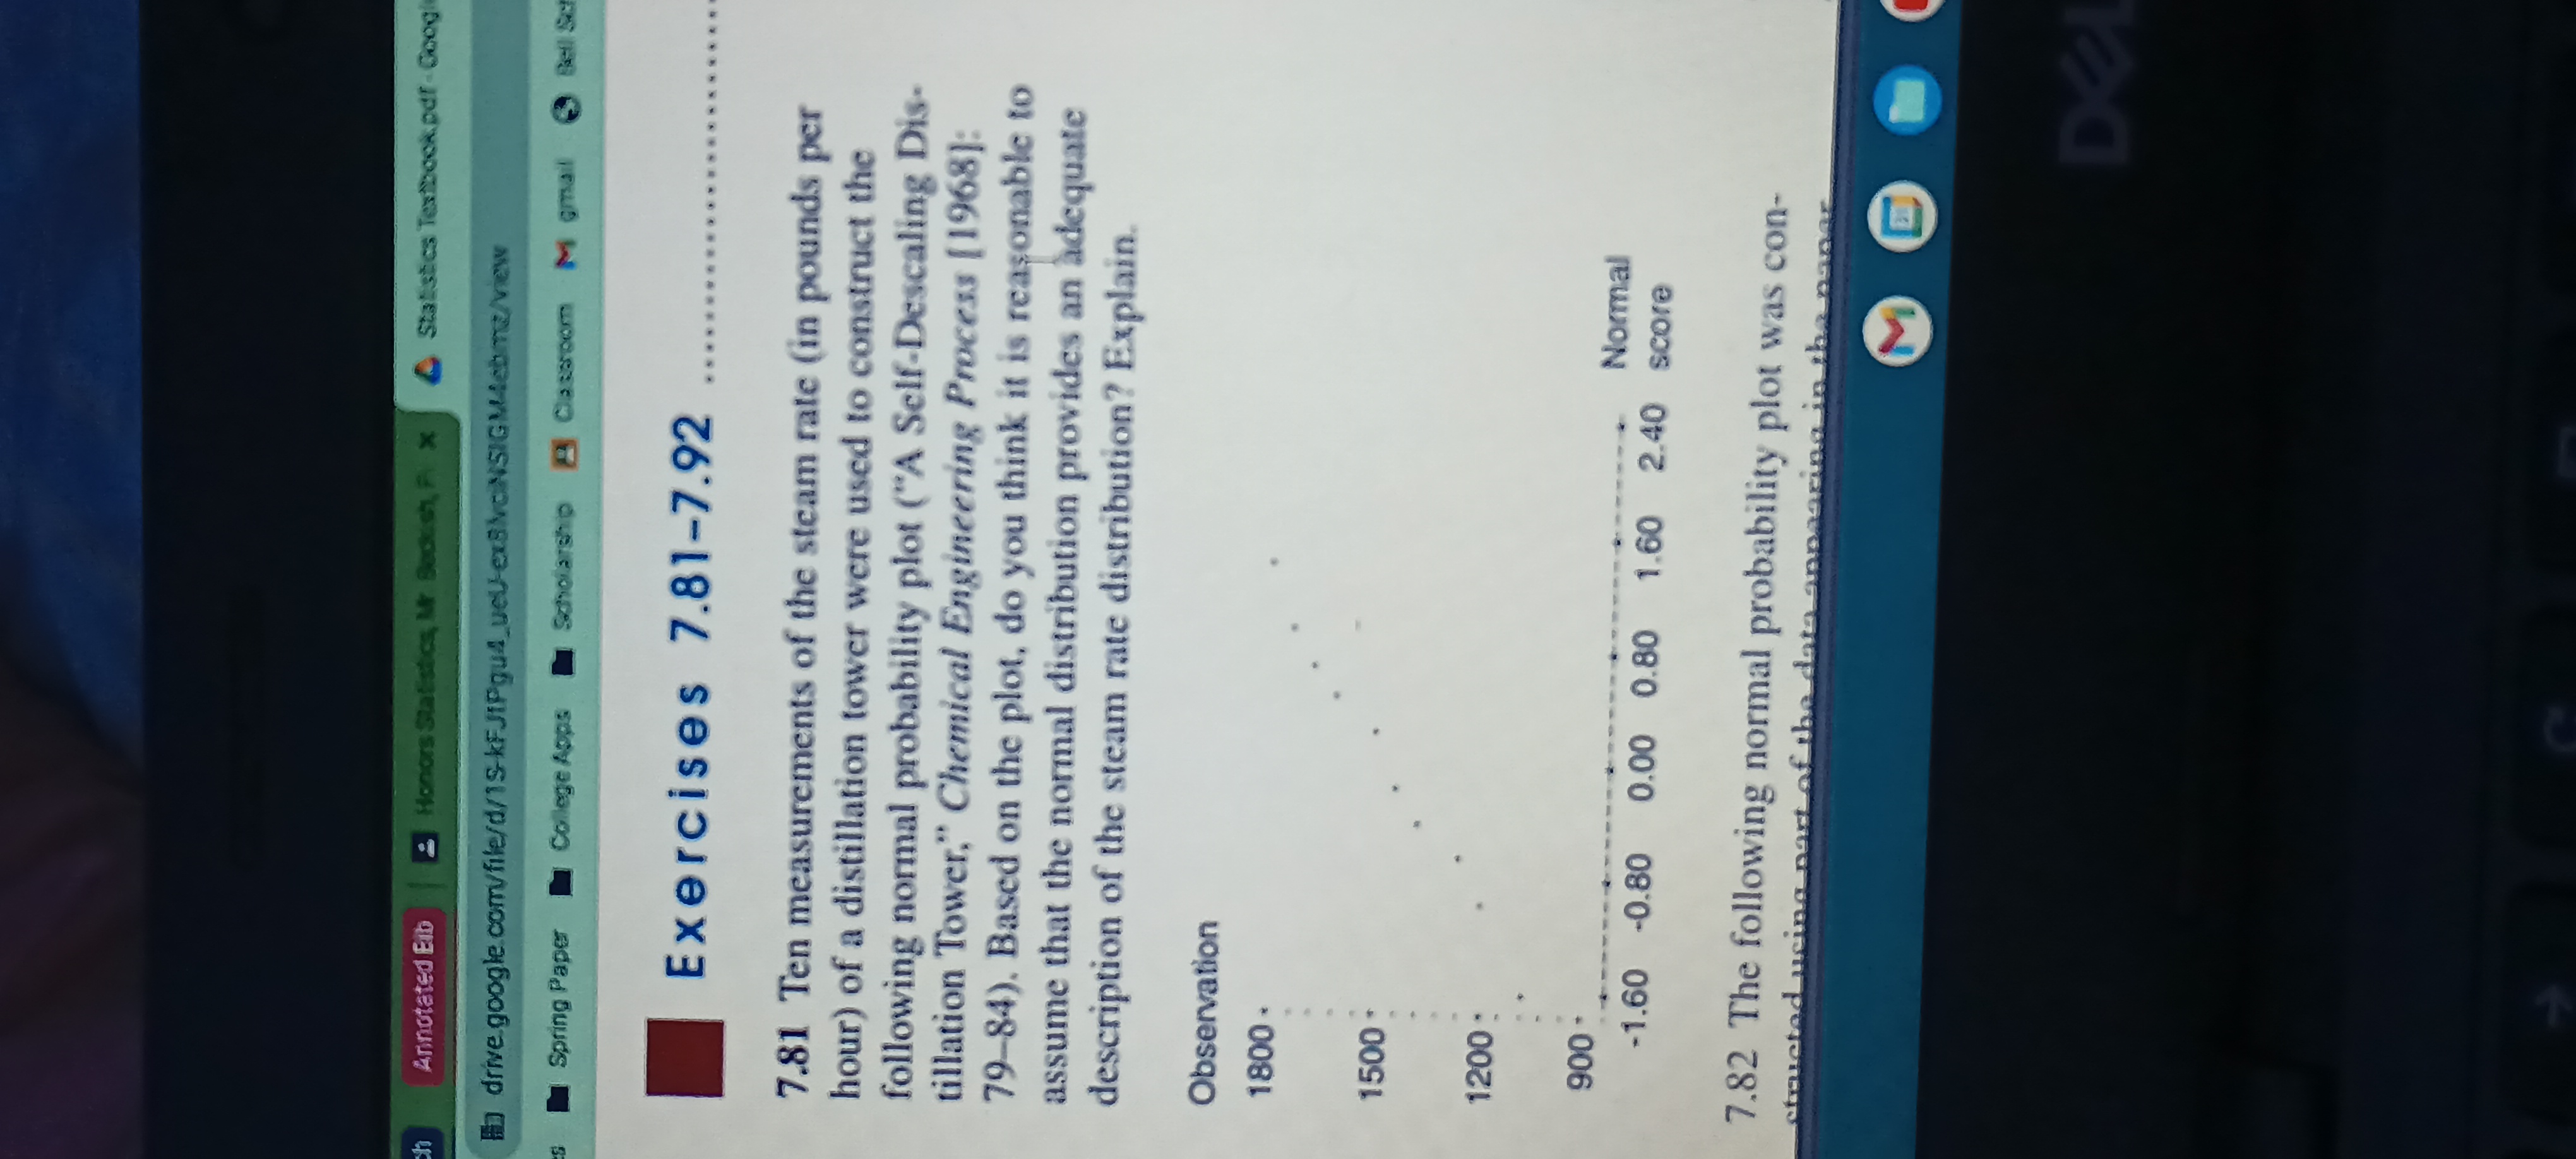
$ Annotated Eib Honors Statistics, Mr Beckish, F x Statistics Textbook.pdf - Google Scholarship B Classroom M gmail Bell Sch drive.google.com/file/d/1S-kFJtPgu4_ueU-ex8NcNSIGM4cbmz/view Spring Paper College Apps Exercises 7.81-7.92 7.81 Ten measurements of the steam rate (in pounds per hour) of a distillation tower were used to construct the following normal probability plot ("A Self-Descaling Dis- tillation Tower," Chemical Engineering Process [1968]: 79-84). Based on the plot, do you think it is reasonable to assume that the normal distribution provides an adequate description of the steam rate distribution? Explain. Observation 1800 - 1500* 1200 900- Normal -1.60 -0.80 0.00 0.80 1.60 2.40 score 7.82 The following normal probability plot was con- data appearing in the papar structed using part of the data app t DEL
Step by Step Solution
There are 3 Steps involved in it

Get step-by-step solutions from verified subject matter experts