

Annual and Average Returns for Stocks, Bonds, and T-Bills, 1950 to 2019 1990 to 1999 1950...
Fantastic news! We've Found the answer you've been seeking!
Question:
Transcribed Image Text:
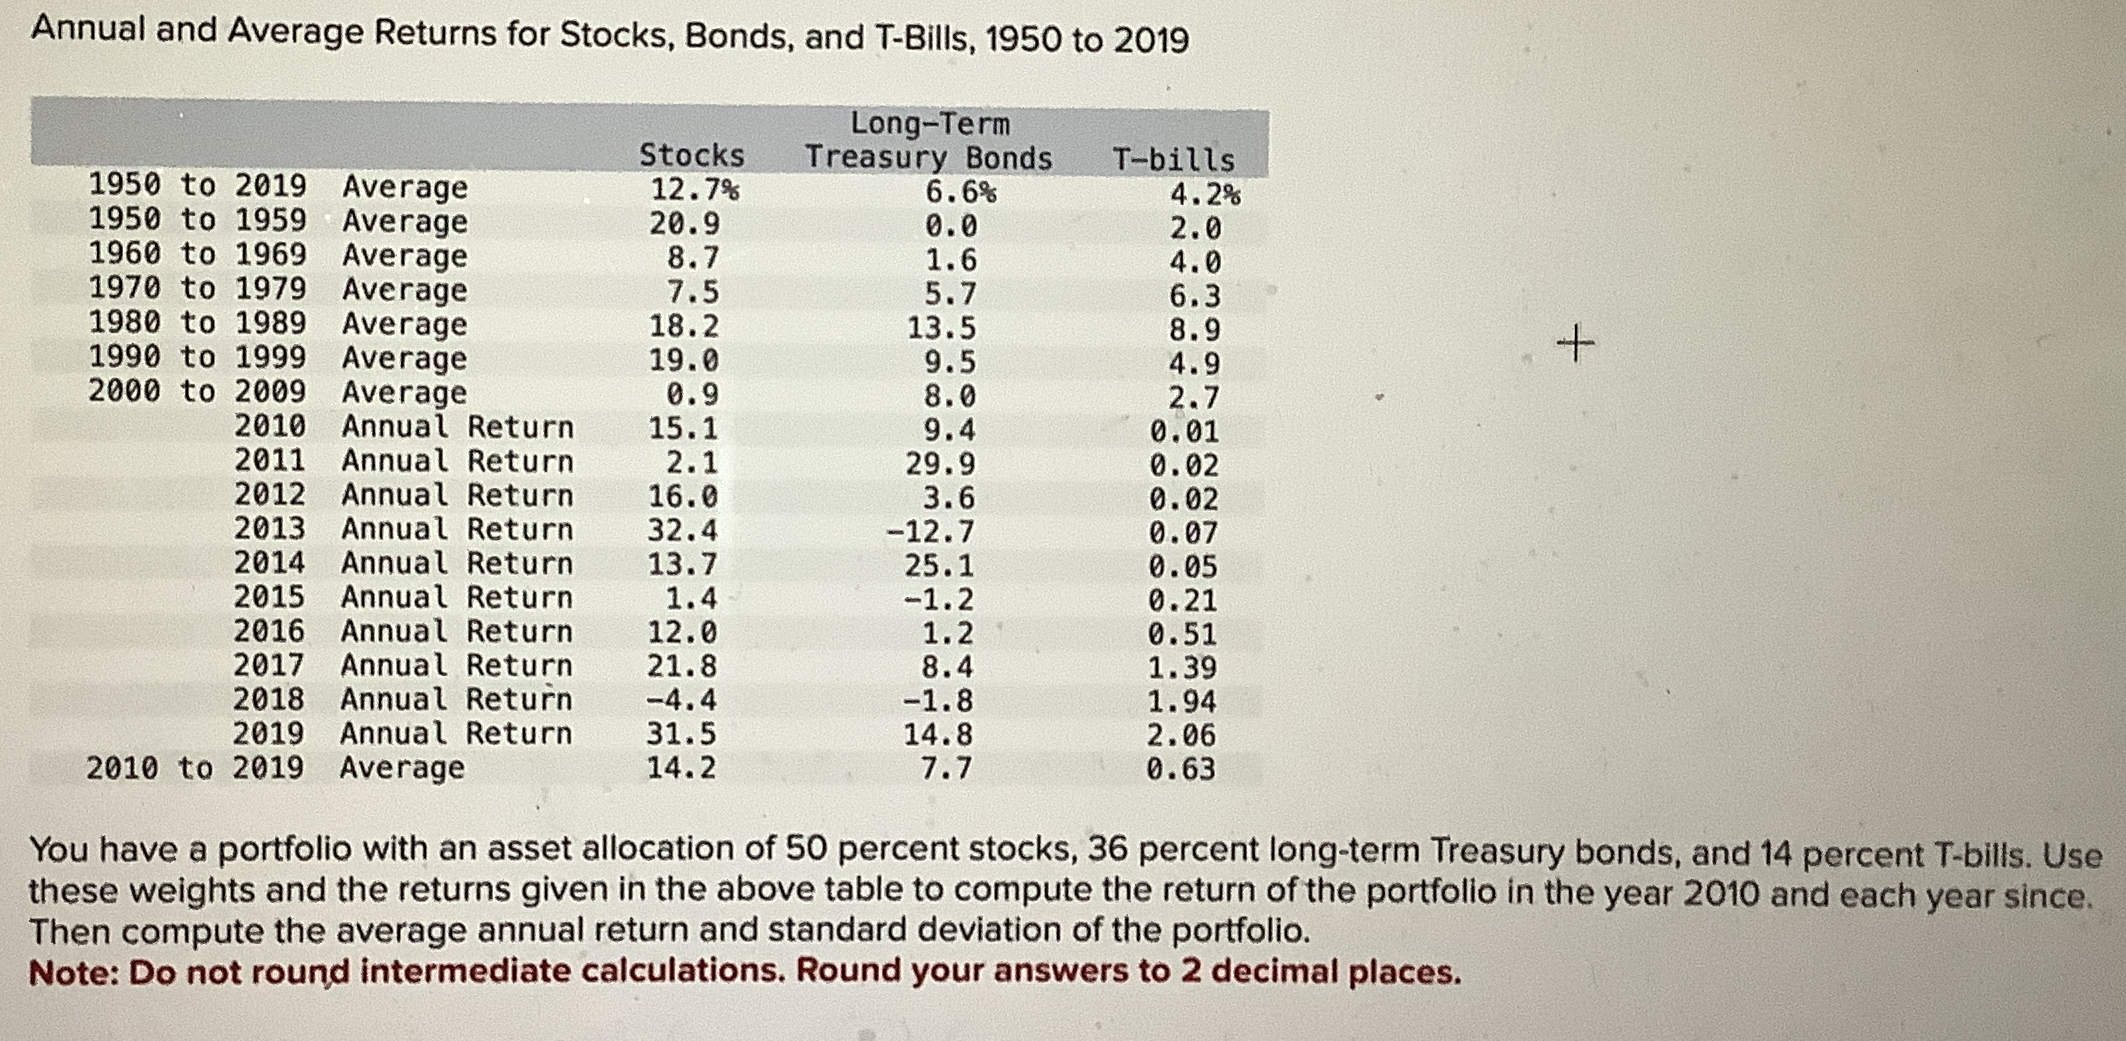
Annual and Average Returns for Stocks, Bonds, and T-Bills, 1950 to 2019 1990 to 1999 1950 to 2019 Average 1950 to 1959 Average 1960 to 1969 Average 1970 to 1979 Average 1980 to 1989 Average Average Stocks 12.7% Long-Term Treasury Bonds T-bills 6.6% 4.2% 20.9 0.0 2.0 8.7 1.6 4.0 7.5 5.7 6.3 18.2 13.5 8.9 19.0 9.5 4.9 2000 to 2009 Average 0.9 8.0 2.7 2010 Annual Return 15.1 9.4 0.01 2011 Annual Return 2.1 29.9 0.02 2012 Annual Return 16.0 3.6 0.02 2013 Annual Return 32.4 -12.7 0.07 2014 Annual Return 2015 Annual Return 2016 Annual Return 13.7 25.1 0.05 1.4 -1.2 0.21 12.0 1.2 0.51 2017 Annual Return 21.8 8.4 1.39 2018 Annual Return -4.4 -1.8 1.94 2019 2010 to 2019 Annual Return 31.5 14.8 2.06 Average 14.2 7.7 0.63 + You have a portfolio with an asset allocation of 50 percent stocks, 36 percent long-term Treasury bonds, and 14 percent T-bills. Use these weights and the returns given in the above table to compute the return of the portfolio in the year 2010 and each year since. Then compute the average annual return and standard deviation of the portfolio. Note: Do not round intermediate calculations. Round your answers to 2 decimal places. Annual and Average Returns for Stocks, Bonds, and T-Bills, 1950 to 2019 1990 to 1999 1950 to 2019 Average 1950 to 1959 Average 1960 to 1969 Average 1970 to 1979 Average 1980 to 1989 Average Average Stocks 12.7% Long-Term Treasury Bonds T-bills 6.6% 4.2% 20.9 0.0 2.0 8.7 1.6 4.0 7.5 5.7 6.3 18.2 13.5 8.9 19.0 9.5 4.9 2000 to 2009 Average 0.9 8.0 2.7 2010 Annual Return 15.1 9.4 0.01 2011 Annual Return 2.1 29.9 0.02 2012 Annual Return 16.0 3.6 0.02 2013 Annual Return 32.4 -12.7 0.07 2014 Annual Return 2015 Annual Return 2016 Annual Return 13.7 25.1 0.05 1.4 -1.2 0.21 12.0 1.2 0.51 2017 Annual Return 21.8 8.4 1.39 2018 Annual Return -4.4 -1.8 1.94 2019 2010 to 2019 Annual Return 31.5 14.8 2.06 Average 14.2 7.7 0.63 + You have a portfolio with an asset allocation of 50 percent stocks, 36 percent long-term Treasury bonds, and 14 percent T-bills. Use these weights and the returns given in the above table to compute the return of the portfolio in the year 2010 and each year since. Then compute the average annual return and standard deviation of the portfolio. Note: Do not round intermediate calculations. Round your answers to 2 decimal places.
Expert Answer:

Posted Date:
Students also viewed these finance questions
-
The director of cost management for Odessa Company uses a statistical control chart to help management determine when to investigate variances. The critical value is 1 standard deviation. The company...
-
You wish to pick an element for a photocell that will operate via the photoelectric effect with visible light. Which of the following are suitable (work functions are in parentheses): tantalum...
-
Language is important as a cultural variable only when one is dealing with a person who speaks a different language.
-
summarize scientific management theory, administrative theory, human relations theory, theory X and theory Y, the contingency approach, and open systems theory.
-
VERTICAL ANALYSIS OF COMPARATIVE FINANCIAL STATEMENTS Refer to the financial statements in Problem 24-8B. REQUIRED Prepare a vertical analysis of the income statement and balance sheet. Show each...
-
g. Repeat the analysis performed the previous question but now assume that Hatfield is able to improve the following inputs: operating costs (excluding depreciation)/sales = 89.5% and...
-
6. Determine if the line /, : (x, y, z) = (4,-8,0) + t(7,21,-14) and another line x = 25 - 8s 12 : y = 55 - 24s z=-42+ 16s parallel or coincident [MARK 8] THINKING 7. Find the parametric equations of...
-
The New York City Marathon is a highly selective race. One way to gain entry into the race is to qualify based on a time from a prior-completed marathon. The NYC Marathon's organizers use this method...
-
There are four areas in the Balanced Scorecard: Financial Perspective Customer Perspective Internal Business Perspective Innovation and Learning Perspective Please provide perspective for each....
-
WHAT DID YOU LEARN FOR CHAPTER 12 - ACCOUNTING INFORMATION SYSTEMS CHAPTER 12 : The first step to protect confidentiality and privacy is to identify where such information resides and who has...
-
Greenwood Ltd., one of the largest commercial builders in the city, has decided to purchase a new piece of equipment due to a very strong order book.You have just been hired as their new financial...
-
Prof. K. visits several mystery islands in the Animal Crossing: New Horizons video game. Each mystery island has one mystery villager on it. Prof. K. gathers the following information about the...
-
If land that is capital property is sold in an ITA 85(1) rollover and the elected amount is less than its ACB because of a decline in FMV, a capital loss will always be immediately allowed. Question...
-
Why can wastewater treatment requirements in Hawaii be less stringent than those in most locations on the U.S. mainland?
-
When is revenue recognized?LO1
-
What criteria has the IASB issued as guidance for revenue recognition?LO9
-
Why might users of financial statements prefer the separate disclosure of gross sales revenue and sales returns and allowances to the disclosure of a single net sales revenue amount? LO13

Study smarter with the SolutionInn App