

Question: Annual average wind speed values over time measured for a residential area located at 27th latitude and 34th longitude are given in the Table.
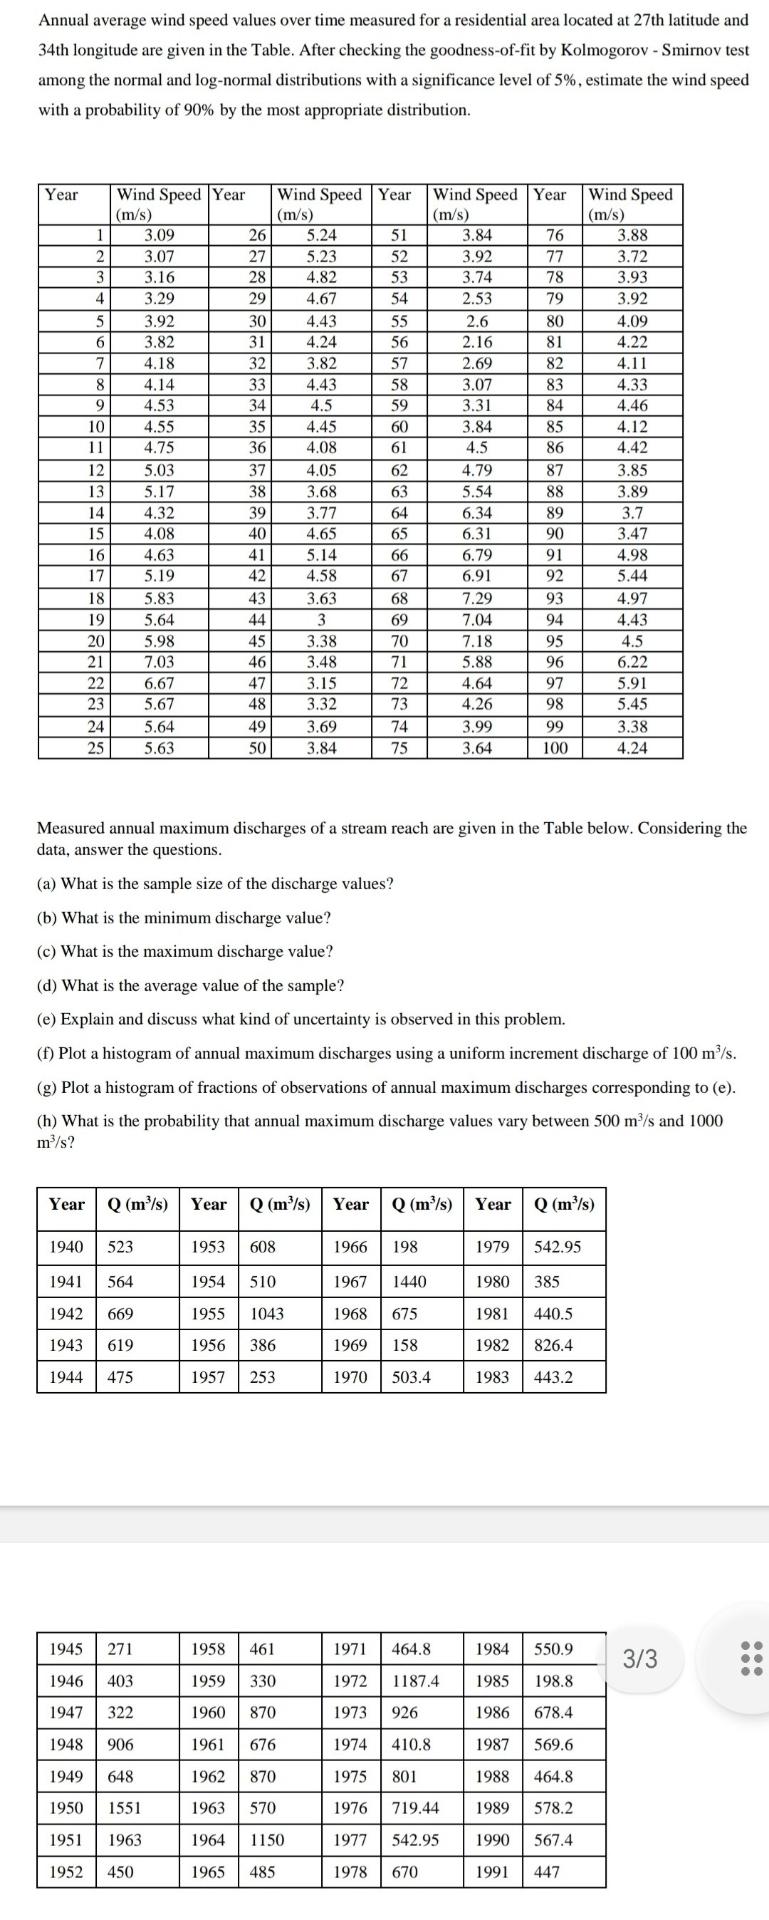
Annual average wind speed values over time measured for a residential area located at 27th latitude and 34th longitude are given in the Table. After checking the goodness-of-fit by Kolmogorov - Smirnov test among the normal and log-normal distributions with a significance level of 5%, estimate the wind speed with a probability of 90% by the most appropriate distribution. Year 1 2 3 4 5 6 7 8 9 10 11 12 13 14 15 16 17 18 19 20 21 22 23 24 25 Wind Speed Year (m/s) 3.09 3.07 3.16 3.29 3.92 3.82 4.18 4.14 4.53 1940 523 1941 564 1942 669 1943 619 1944 475 4.55 4.75 5.03 5.17 4.32 4.08 4.63 5.19 1945 271 1946 403 1947 322 1948 906 1949 648 1950 1551 1951 1963 1952 450 5.83 5.64 5.98 7.03 6.67 5.67 5.64 5.63 26 27 28 29 30 31 32 33 34 35 36 37 38 39 40 41 42 43 44 45 46 47 48 49 50 Wind Speed Year (m/s) 1953 608 5.24 5.23 4.82 4.67 4.43 4.24 3.82 4.43 4.5 1954 510 1955 1043 1956 386 1957 253 4.45 4.08 4.05 3.68 3.77 4.65 5.14 4.58 3.63 3 Year Q (m/s) Year Q (m/s) 1958 461 1959 330 1960 870 1961 676 1962 870 1963 570 1964 1150 1965 485 3.38 3.48 3.15 3.32 3.69 3.84 51 52 53 54 55 56 57 58 59 60 61 62 63 64 65 66 67 68 69 70 71 72 73 74 75 Wind Speed Year (m/s) Year Q (m/s) 1966 198 1967 1440 1968 675 1969 158 1970 503.4 3.84 3.92 3.74 2.53 2.6 2.16 2.69 3.07 3.31 1971 464.8 1972 1187.4 1973 926 1974 410.8 1975 801 1976 1977 542.95 1978 670 3.84 4.5 4.79 5.54 6.34 6.31 6.79 6.91 7.29 7.04 7.18 5.88 4.64 4.26 3.99 3.64 Year 76 77 78 79 1979 80 81 82 83 84 85 86 87 88 89 90 91 92 Measured annual maximum discharges of a stream reach are given in the Table below. Considering the data, answer the questions. (a) What is the sample size of the discharge values? (b) What is the minimum discharge value? (c) What is the maximum discharge value? (d) What is the average value of the sample? (e) Explain and discuss what kind of uncertainty is observed in this problem. (f) Plot a histogram of annual maximum discharges using a uniform increment discharge of 100 m/s. (g) Plot a histogram of fractions of observations of annual maximum discharges corresponding to (e). (h) What is the probability that annual maximum discharge values vary between 500 m/s and 1000 m/s? 93 94 95 96 97 98 99 100 Wind Speed (m/s) Q (m/s) 542.95 1980 385 1981 440.5 1982 826.4 1983 443.2 3.88 3.72 3.93 3.92 4.09 4.22 4.11 4.33 4.46 4.12 4.42 3.85 3.89 3.7 3.47 4.98 5.44 4.97 4.43 4.5 6.22 5.91 5.45 3.38 4.24 1984 550.9 3/3 1985 198.8 1986 678.4 1987 569.6 1988 464.8 719.44 1989 578.2 1990 567.4 1991 447 ...
Step by Step Solution
There are 3 Steps involved in it
To analyze the given data we can use MATLAB to perform the necessary calculations and generate the r... View full answer

Get step-by-step solutions from verified subject matter experts