

Question: Annual maxima flow rate data at Redbrook on the River Wye table [ [ Water year sak flow rate ( m 3 / s
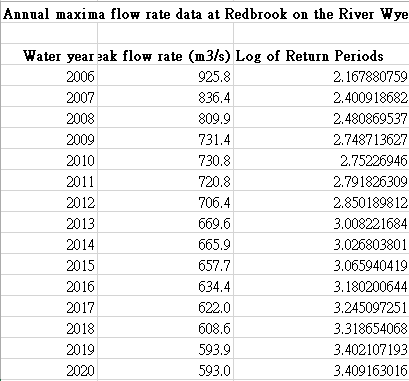
Annual maxima flow rate data at Redbrook on the River Wye
tableWater year sak flow rate msLog of Return Periods,Using the peak flow annual maxima data given in the spreadsheet QRiverWye determine the empirical return period for the highest flow rates based on the Gringorten plotting position formula given by:
Return Periodni
where:
n total number of years in entire data set
i rank of data from the largest i to the smallest in
Fitting a loglinear best fit to the data, where the return period on the xaxis is logged, estimate the flow rate of an event with a return period of years.
Step by Step Solution
There are 3 Steps involved in it
1 Expert Approved Answer
Step: 1 Unlock

Question Has Been Solved by an Expert!
Get step-by-step solutions from verified subject matter experts
Step: 2 Unlock
Step: 3 Unlock