

Question: Annual rainfalls for Metropolis are given in the table below (Annual maximums of, 2013). The box plot above provides one visual depiction of the data
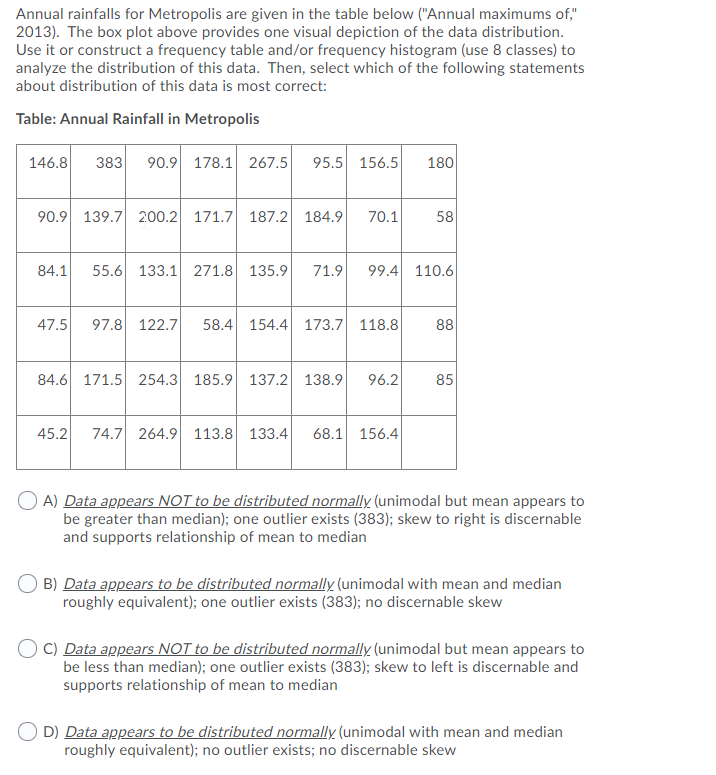
Annual rainfalls for Metropolis are given in the table below ("Annual maximums of," 2013). The box plot above provides one visual depiction of the data distribution. Use it or construct a frequency table and/or frequency histogram (use 8 classes) to analyze the distribution of this data. Then, select which of the following statements about distribution of this data is most correct: Table: Annual Rainfall in Metropolis 146.8 383 90.9 178.1 267.5 95.5 156.5 180 90.9 139.7 200.2 171.7 187.2 184.9 70.1 58 84.1 55.6 133.1 271.8 135.9 71.9 99.4 110.6 47.5 97.8 122.7 58.4 154.4 173.7 118.8 88 84.6 171.5 254.3 185.9 137.2 138.9 96.2 85 45.2 74.7 264.9 113.8 133.4 68.1 156.4 ()A) Data appears NOT to be distributed normally (unimodal but mean appears to be greater than median); one outlier exists (383); skew to right is discernable and supports relationship of mean to median ( B) Data appears to be distributed normally (unimodal with mean and median roughly equivalent); one outlier exists (383); no discernable skew (C) Data appears NOT to be distributed normally (unimodal but mean appears to be less than median); one outlier exists (383); skew to left is discernable and supports relationship of mean to median ( D) Data appears to be distributed normally (unimodal with mean and median roughly equivalent); no outlier exists; no discernable skew
Step by Step Solution
There are 3 Steps involved in it

Get step-by-step solutions from verified subject matter experts