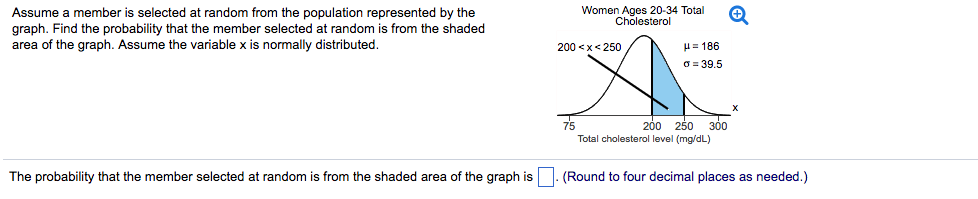
Question: ANOTHER Assume a member is selected at random from the population represented by the Womrbgls ill-1r TOW graph' Find the probability that the member selected

ANOTHER

ANOTHER Assume a member is selected at randomANOTHER Assume a member is selected at randomANOTHER Assume a member is selected at randomANOTHER Assume a member is selected at randomANOTHER Assume a member is selected at random
Assume a member is selected at random from the population represented by the Womrbgls ill-1r TOW graph' Find the probability that the member selected at random is trom the shaded as m area of the graph. Assume the variable x is normally distributed. T5 200 250 330 Total druleallerul level {mgl'dLJ The probability that the member selected at random is from the shaded area of the graph is D (Round tofour decimal places as needed.) A gear has been designed to have a diameter of 4 inches. The standard deviation of the process is 0.4 inch. A control chart is shown. Each chart has horizontal lines drawn at the meanI u, 1,1120. and at uio. Determine if the process shown is in control or out of control. Explain. g Gears a q: Dian-raiser [Incl'laa] 2'tttltlttltl_, 01234567391011 Observation number s the process in control or out cfccntrol? Select all that apply. A. In control, because none of the three warning signals detected a change. B. Out of control, because a point lies more than three standard deviations beyond the mean. 0. Out of control, because two out of three consecutive points lie more than two standard deviations from the mean. D. Out of control, because there are nine mnsecutive points either above or below the mean. Use the correction for continuity and determine the normal probability statement that corresponds to the binomial probability statement Binomial Probability 50: 1I'JT.5) 0 D. P(x>1t'Ja.5) Find lhe indicated zsoores shown in the graph. a Click to View gs 1 of the Standard Normal Table Click to View page 2 of the Standard Normal Table. 22'? 2:? The zseoras are D. (Use a comma to separate answers as needed. Round to two decimal places as needed.) For the standard normal distribution shown on the right. nd the probability of z oooun'ing in the indicated region. Click here to View age '1 of the standard normal table Click here to View page 2 of the standard normal table. The probability is :|. (Round to four decimal places as needed.)

Step by Step Solution

There are 3 Steps involved in it

1 Expert Approved Answer
Step: 1 Unlock blur-text-image
Question Has Been Solved by an Expert!

Get step-by-step solutions from verified subject matter experts

Step: 2 Unlock
Step: 3 Unlock

Students Have Also Explored These Related Mathematics Questions!