

Question: Anova hypothesis testing. Please see the attached image for the question problem. You would like to see if there is a difference in the mean
Anova hypothesis testing. Please see the attached image for the question problem.
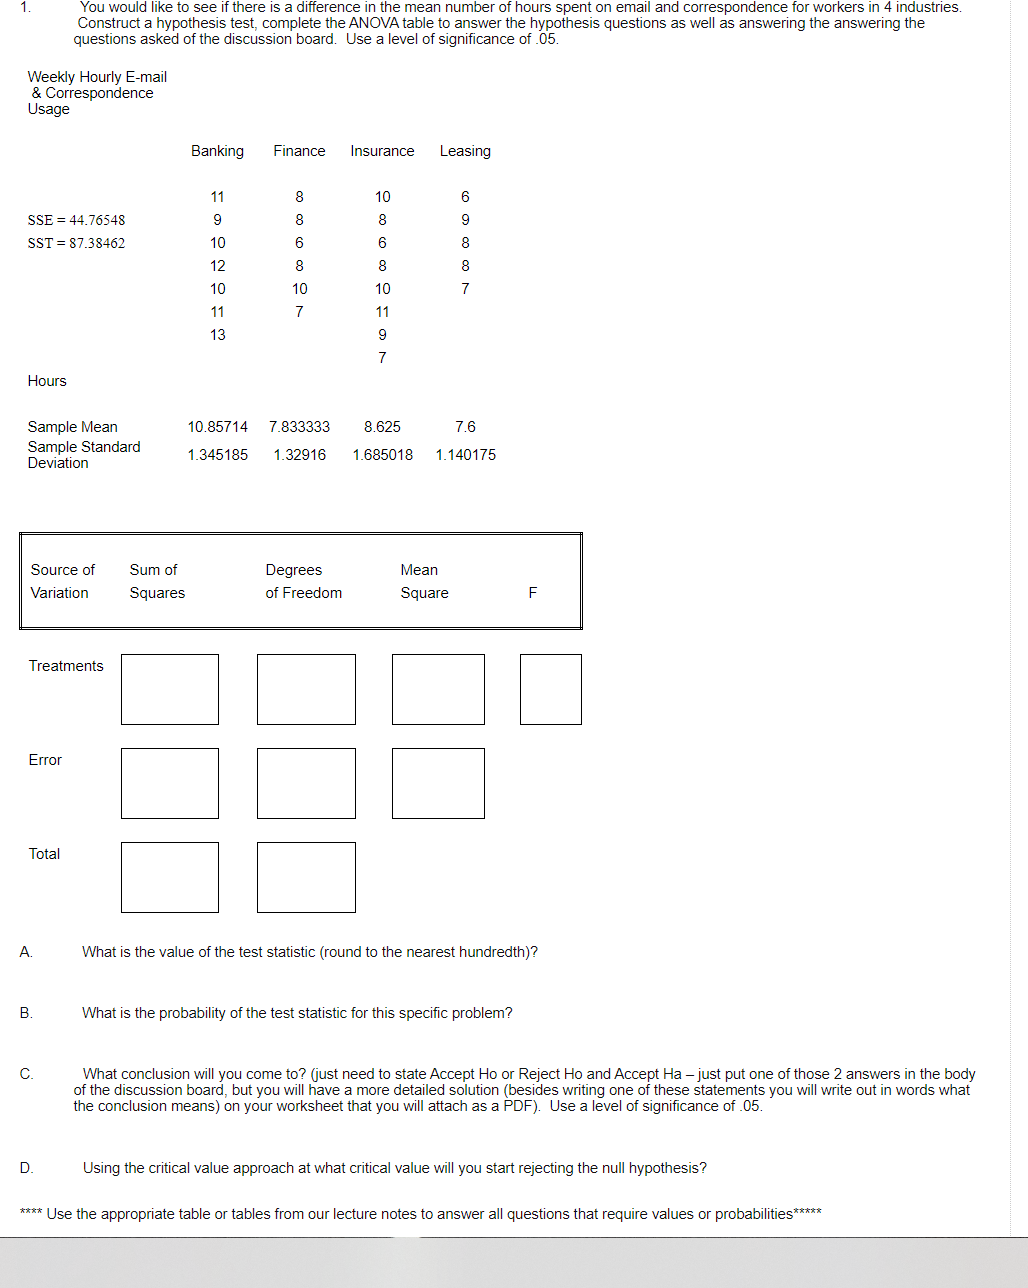
You would like to see if there is a difference in the mean number of hours spent on email and correspondence for workers in 4 industries. Construct a hypothesis test, complete the ANOVA table to answer the hypothesis questions as well as answering the answering the questions asked of the discussion board. Use a level of significance of .05. Weekly Hourly E-mail & Correspondence Usage Banking Finance Insurance Leasing 11 SSE = 44.76548 9 SST = 87.38462 10 12 10 11 13 Hours Sample Mean 10.85714 7.833333 8.625 7.6 Sample Standard Deviation 1.345185 1.32916 1.685018 1.140175 Source of Sum of Degrees Mean Variation Squares of Freedom Square F Treatments Error Total A What is the value of the test statistic (round to the nearest hundredth)? B What is the probability of the test statistic for this specific problem? C. What conclusion will you come to? (just need to state Accept Ho or Reject Ho and Accept Ha - just put one of those 2 answers in the body of the discussion board, but you will have a more detailed solution (besides writing one of these statements you will write out in words what the conclusion means) on your worksheet that you will attach as a PDF). Use a level of significance of .05. D Using the critical value approach at what critical value will you start rejecting the null hypothesis? **** Use the appropriate table or tables from our lecture notes to answer all questions that require values or probabilities* * ** *
Step by Step Solution
There are 3 Steps involved in it

Get step-by-step solutions from verified subject matter experts