

Question: ANOVA table Source Regression Residual Total Regression output Variables Intercept Slope SS 3,080.89 df MS F p-value 1 3,080.89 4.51 .0478 12,288.31 15,369.20 18
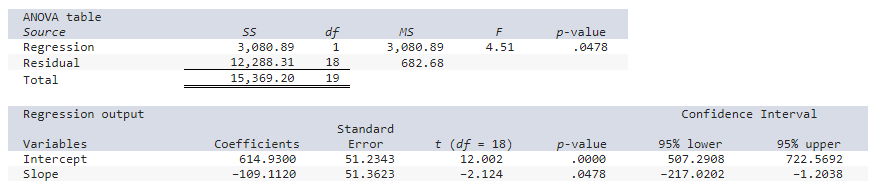
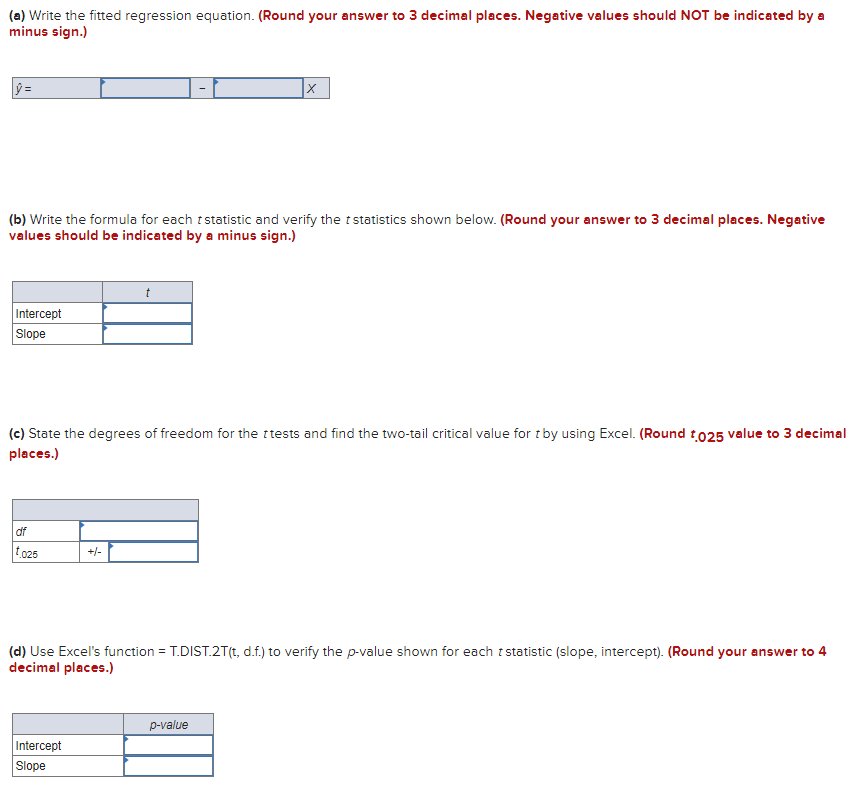
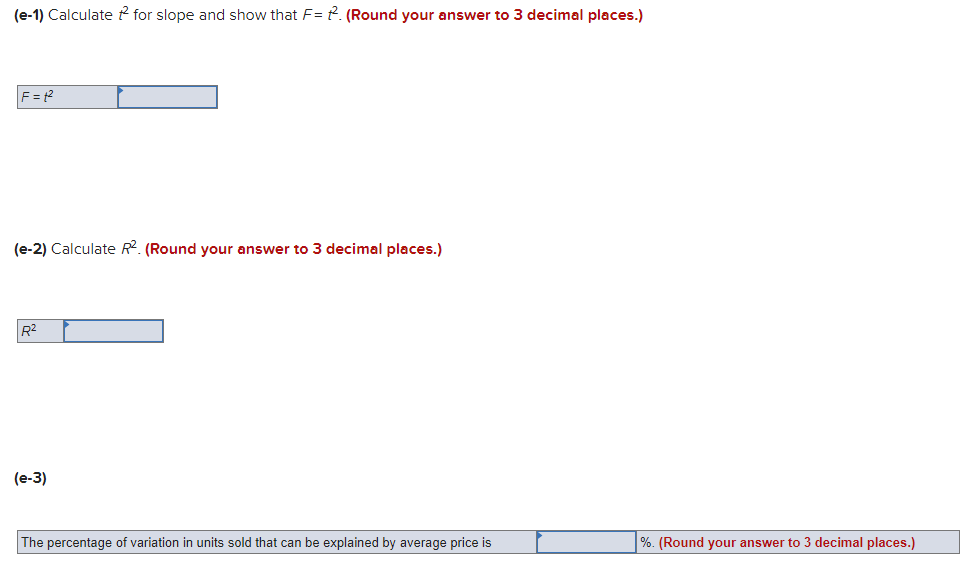
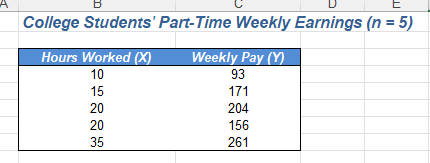
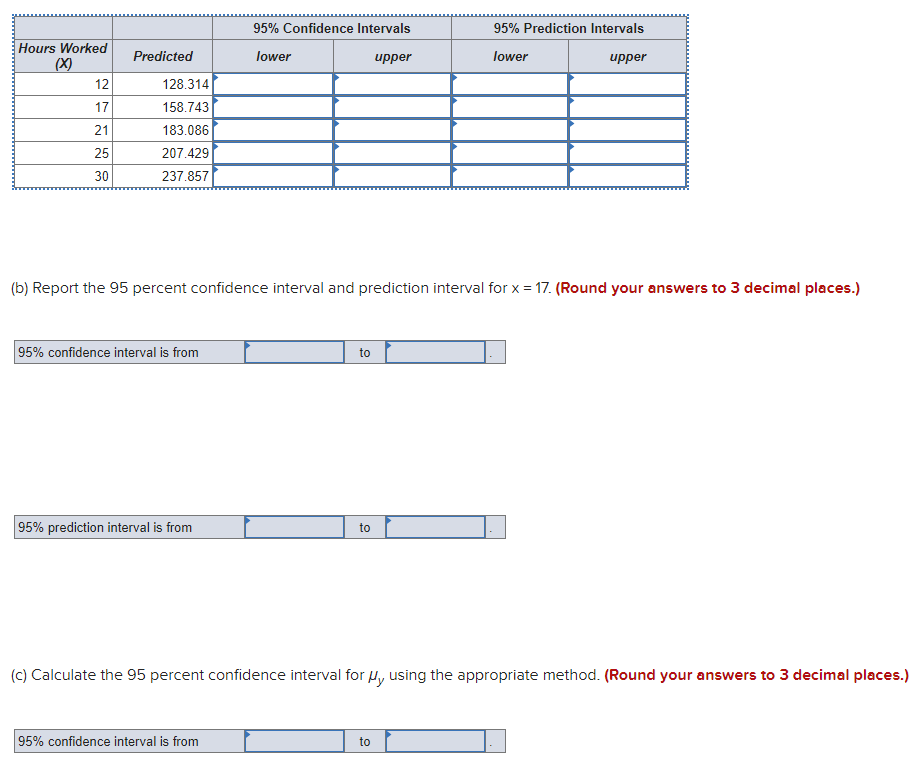
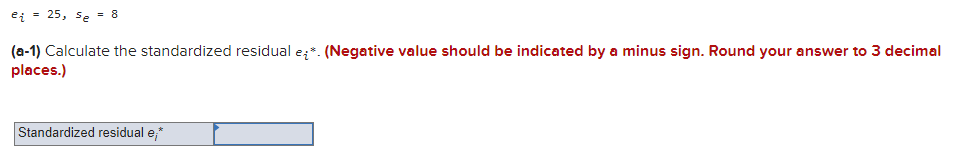

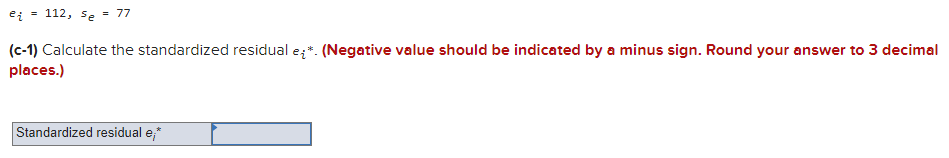
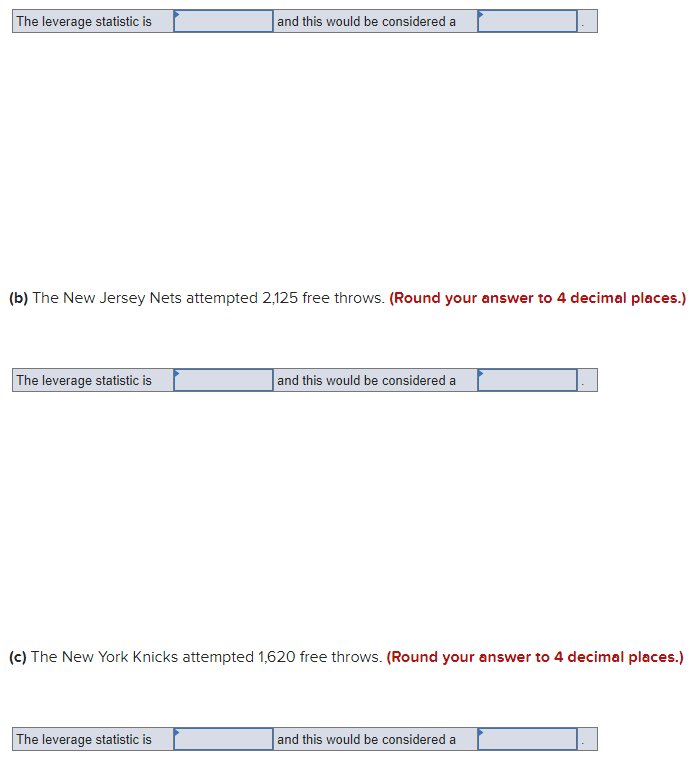
ANOVA table Source Regression Residual Total Regression output Variables Intercept Slope SS 3,080.89 df MS F p-value 1 3,080.89 4.51 .0478 12,288.31 15,369.20 18 682.68 19 Coefficients 614.9300 -109.1120 Standard Error t (df = 18) 51.2343 12.002 51.3623 -2.124 p-value .0000 .0478 Confidence Interval 95% lower 507.2908 -217.0202 95% upper 722.5692 -1.2038 (a) Write the fitted regression equation. (Round your answer to 3 decimal places. Negative values should NOT be indicated by a minus sign.) | = (b) Write the formula for each t statistic and verify the t statistics shown below. (Round your answer to 3 decimal places. Negative values should be indicated by a minus sign.) Intercept Slope (c) State the degrees of freedom for the t tests and find the two-tail critical value for t by using Excel. (Round 1025 value to 3 decimal places.) df 1025 +/- (d) Use Excel's function = T.DIST.2T(t, d.f.) to verify the p-value shown for each t statistic (slope, intercept). (Round your answer to 4 decimal places.) Intercept Slope p-value (e-1) Calculate for slope and show that F= f. (Round your answer to 3 decimal places.) F = 12 (e-2) Calculate R2. (Round your answer to 3 decimal places.) R2 (e-3) The percentage of variation in units sold that can be explained by average price is %. (Round your answer to 3 decimal places.) A E College Students' Part-Time Weekly Earnings (n = 5) Hours Worked (X) Weekly Pay (Y) 10 15 93 171 20 204 20 156 35 261 Hours Worked (X) 95% Confidence Intervals Predicted lower 12 128.314 17 158.743 21 183.086 25 207.429 30 237.857 upper 95% Prediction Intervals lower upper (b) Report the 95 percent confidence interval and prediction interval for x = 17. (Round your answers to 3 decimal places.) 95% confidence interval is from to 95% prediction interval is from to (c) Calculate the 95 percent confidence interval for y using the appropriate method. (Round your answers to 3 decimal places.) 95% confidence interval is from to ei = 25, Se = 8 (a-1) Calculate the standardized residual e*. (Negative value should be indicated by a minus sign. Round your answer to 3 decimal places.) Standardized residual e,* ei = -15, se = 7 (b-1) Calculate the standardized residual e*. (Negative value should be indicated by a minus sign. Round your answer to 3 decimal places.) Standardized residual e,* ei = 112, se = 77 (c-1) Calculate the standardized residual e*. (Negative value should be indicated by a minus sign. Round your answer to 3 decimal places.) Standardized residual e,* The leverage statistic is and this would be considered a (b) The New Jersey Nets attempted 2,125 free throws. (Round your answer to 4 decimal places.) The leverage statistic is and this would be considered a (c) The New York Knicks attempted 1,620 free throws. (Round your answer to 4 decimal places.) The leverage statistic is and this would be considered a
Step by Step Solution
There are 3 Steps involved in it

Get step-by-step solutions from verified subject matter experts