

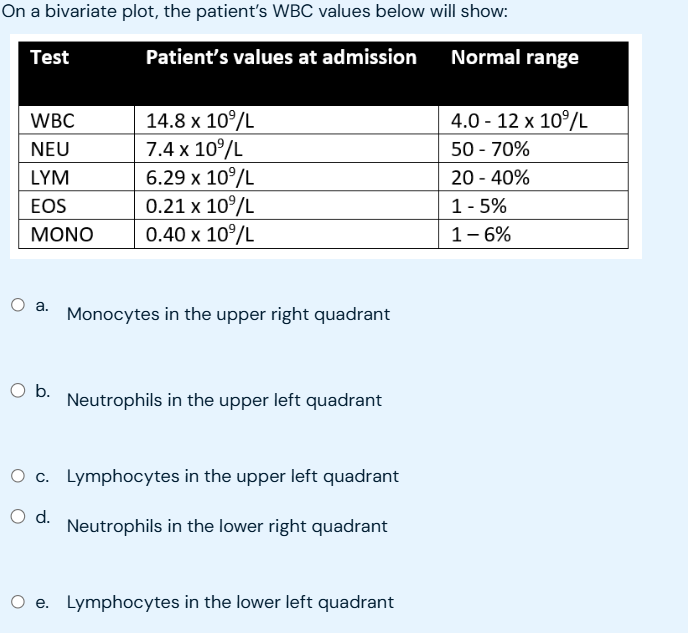
Question: ans On a bivariate plot, the patient's WBC values below will show: Test Patient's values at admission Normal range WBC 14.8 x 10⁹/L 4.0 -
ans
Step by Step Solution
There are 3 Steps involved in it
1 Expert Approved Answer
Step: 1 Unlock

Question Has Been Solved by an Expert!
Get step-by-step solutions from verified subject matter experts
Step: 2 Unlock
Step: 3 Unlock