

Question: Answer 2 . 5 8 not 2 . 5 6 . Plot the grain size distribution curve and classify the soils according to both USCS
Answer not Plot the grain size distribution curve and classify the soils according to both USCS and AASHTO.
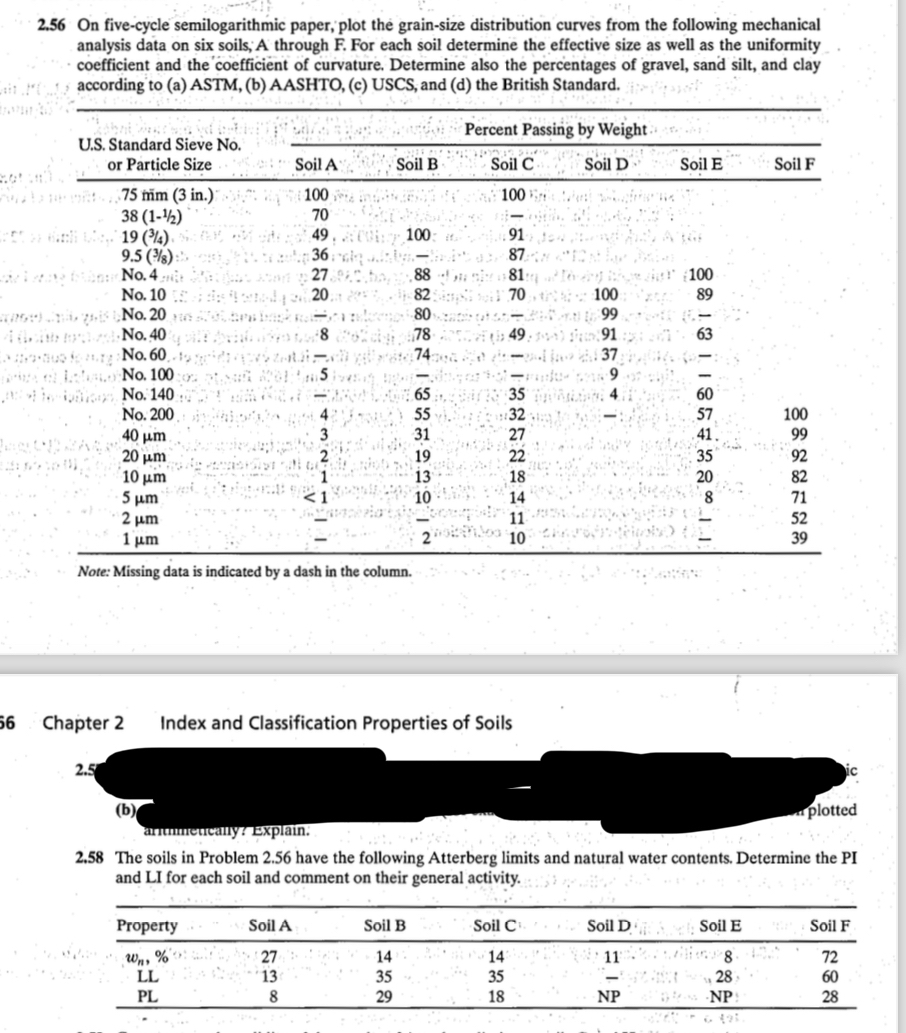
The soils in Problem have the following Atterberg limits and natural water contents. Determine the PI
and LI for each soil and comment on their general activity.
On fivecycle semilogarithmic paper, plot the grainsize distribution curves from the following mechanical
analysis data on six soils; A through F For each soil determine the effective size as well as the uniformity
coefficient and the coefficient of curvature. Determine also the percentages of gravel, sand silt, and clay
according to a ASTM, b AASHTO, c USCS, and d the British Standard.
Note: Missing data is indicated by a dash in the column.
Chapter Index and Classification Properties of Soils
The soils in Problem have the following Atterberg limits and natural water contents. Determine the PI
and LI for each soil and comment on their general activity.
Step by Step Solution
There are 3 Steps involved in it
1 Expert Approved Answer
Step: 1 Unlock

Question Has Been Solved by an Expert!
Get step-by-step solutions from verified subject matter experts
Step: 2 Unlock
Step: 3 Unlock