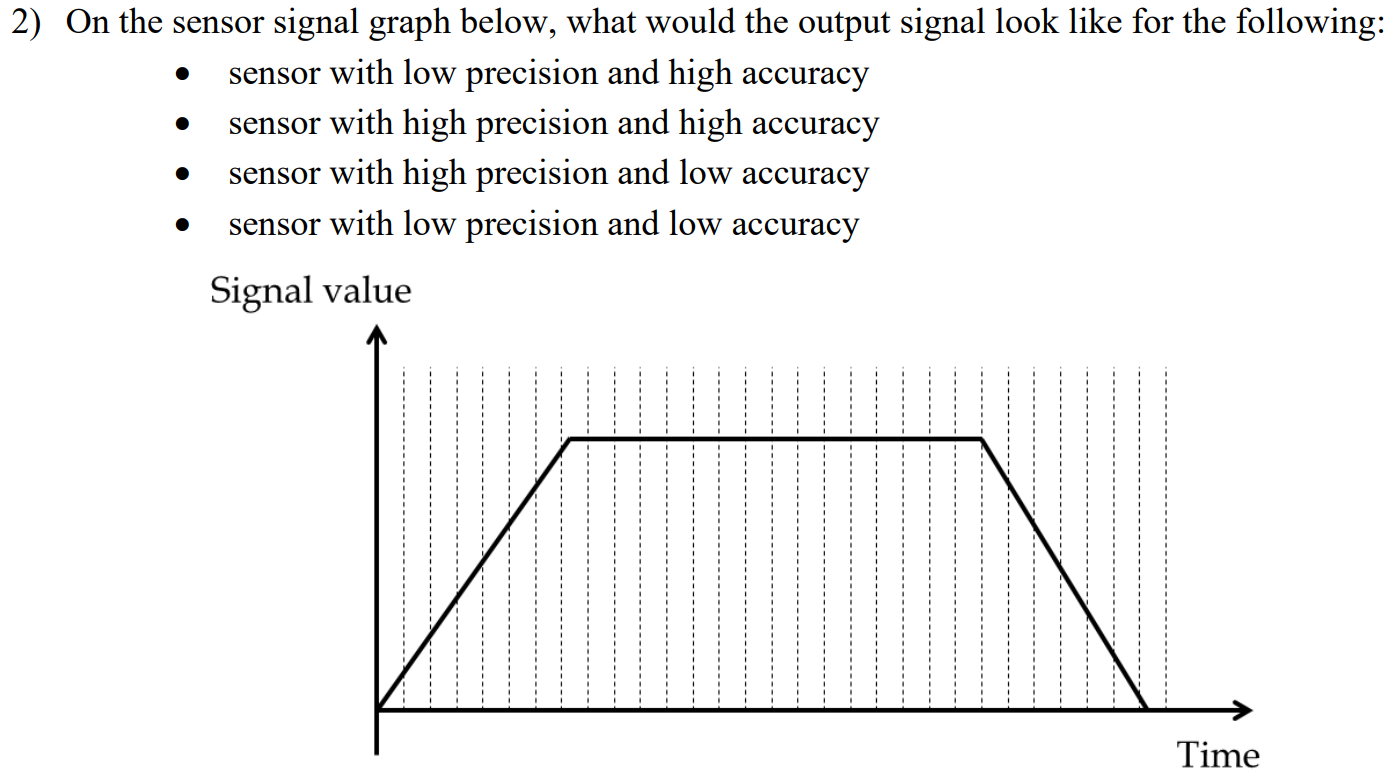
Question: answer 2) On the sensor signal graph below, what would the output signal look like for the following: e sensor with low precision and high

answer

answer 2) On the sensor signal graph below, what
2) On the sensor signal graph below, what would the output signal look like for the following: e sensor with low precision and high accuracy e sensor with high precision and high accuracy e sensor with high precision and low accuracy e sensor with low precision and low accuracy Signal value

Step by Step Solution

There are 3 Steps involved in it

1 Expert Approved Answer
Step: 1 Unlock blur-text-image
Question Has Been Solved by an Expert!

Get step-by-step solutions from verified subject matter experts

Step: 2 Unlock
Step: 3 Unlock

Students Have Also Explored These Related Business Writing Questions!