

Question: Answer 4 and 5 4) Below is a graph which shows plant growth rates (Y) vs. application ofa dosage of fertilizer ( X), and the
Answer 4 and 5
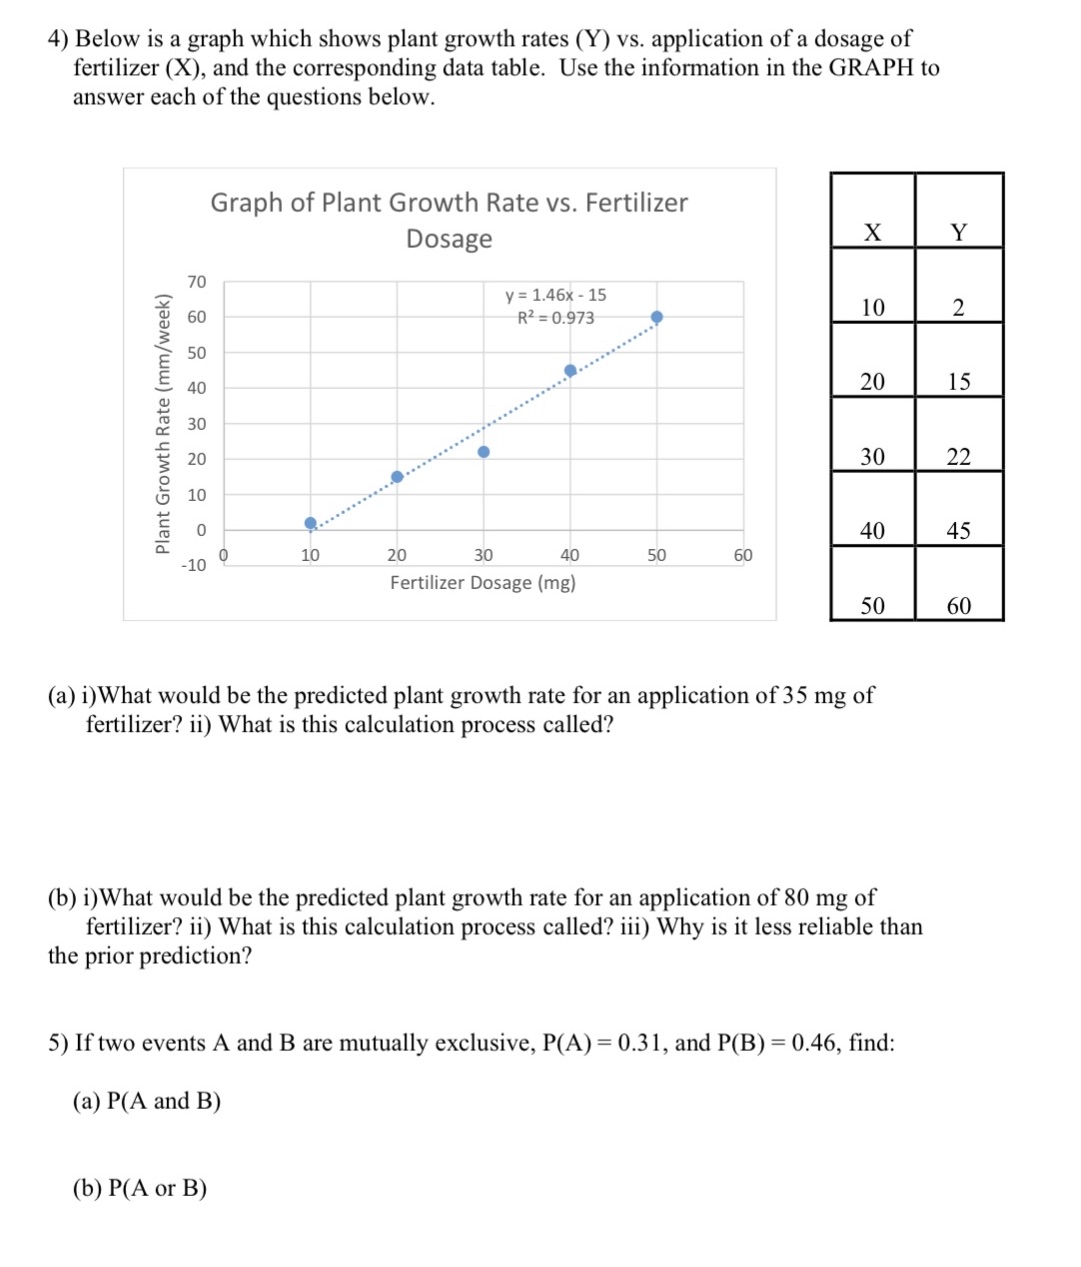
4) Below is a graph which shows plant growth rates (Y) vs. application ofa dosage of fertilizer ( X), and the corresponding data table. Use the information in the GRAPH to answer each of the questions below. Graph of Plant Growth Rate vs. Fertilizer Dosage 70 y = 1.45 15 60 FF = 0.973 9 so ' 40 30 10 Plant Growth Rate {mm/week] _10 0 10 20 30 4O 50 60 Fertilizer Dosage {mg} (a) i)What would be the predicted plant growth rate for an application of 35 mg of fertilizer? ii) What is this calculation process called? (b) i)What would be the predicted plant growth rate for an application of 80 mg of fertilizer? ii) What is this calculation process called? iii) Why is it less reliable than the prior prediction? 5) Iftwo events A and B are mutually exclusive, P(A) = 0.3 l, and HR) = 0.46, nd: (a) P(A and B) (b) P(A or B)
Step by Step Solution
There are 3 Steps involved in it

Get step-by-step solutions from verified subject matter experts