

Question: Answer 5a,5b,5c using section 3 which I answered 3 For the test score data to the left, start by finding the difference in 5 Answer
Answer 5a,5b,5c using section 3 which I answered
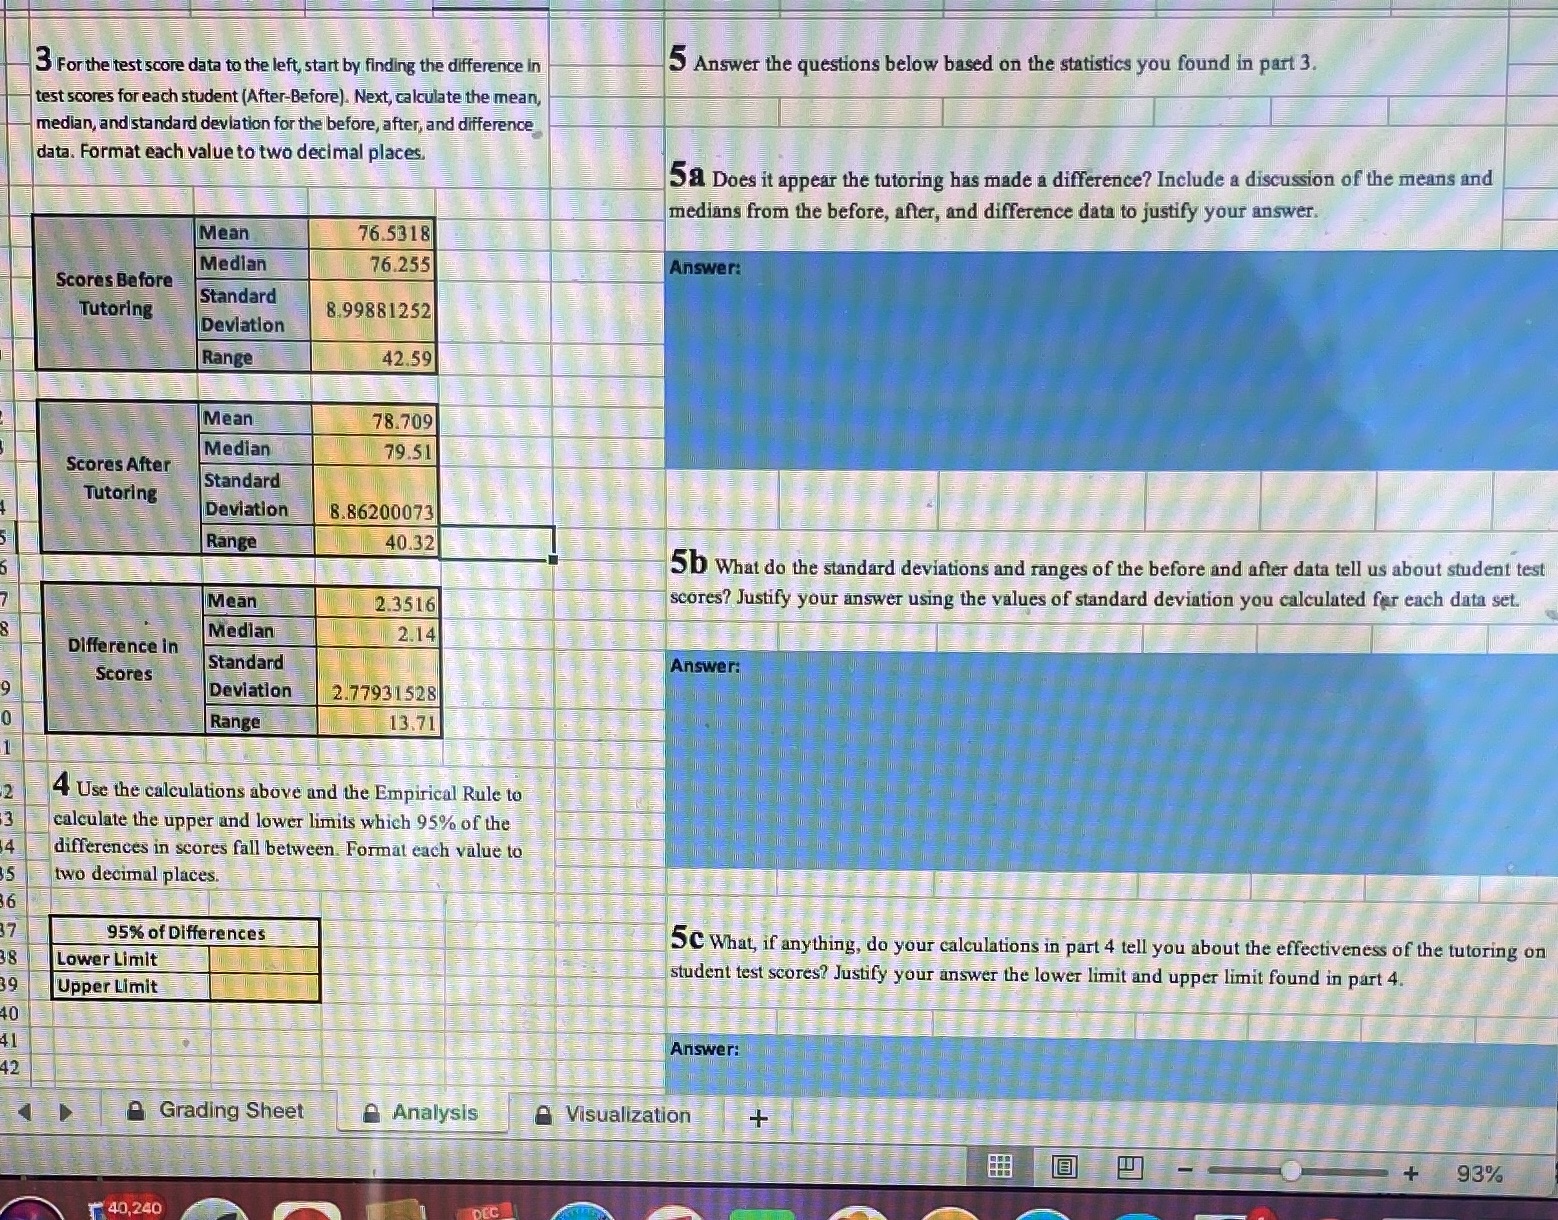
3 For the test score data to the left, start by finding the difference in 5 Answer the questions below based on the statistics you found in part 3. test scores for each student (After-Before). Next, calculate the mean, median, and standard deviation for the before, after, and difference data. Format each value to two decimal places. 58 Does it appear the tutoring has made a difference? Include a discussion of the means and medians from the before, after, and difference data to justify your answer. Mean 76.5318 Median 76.255 Answer: Scores Before Standard Tutoring 8.99881252 Deviation Range 42.59 Mean 78.709 Median 79.51 Scores After Standard Tutoring Deviation 8.86200073 Range 40.32 5b What do the standard deviations and ranges of the before and after data tell us about student test Mean 2.3516 scores? Justify your answer using the values of standard deviation you calculated for each data set. Median 2.14 Difference in Standand Answer: Scores Deviation 2.77931528 Range 13.71 4 Use the calculations above and the Empirical Rule to calculate the upper and lower limits which 95% of the differences in scores fall between. Format each value to two decimal places. 36 95% of Differences 5C What, if anything, do your calculations in part 4 tell you about the effectiveness of the tutoring on Lower Limit student test scores? Justify your answer the lower limit and upper limit found in part 4. Upper Limit 10 Answer: 42 Grading Sheet Analysis A Visualization + 93% 40,240
Step by Step Solution
There are 3 Steps involved in it

Get step-by-step solutions from verified subject matter experts