Answer 6 study questions.
1.How should BioPharma have used its production network in 2013? Should any of the plants have been idled? What is the annual cost of your proposal, including import duties?
2. How should Landgraf structure his global production net-work? Assume that the past is a reasonable indicator of the future in terms of exchange rates.
3. Is there any plant for which it may be worth adding a mil-lion kilograms of additional capacity at a fixed cost of $3 million per year?
4. How are your recommendations affected by the reduction of duties?
5. The analysis has assumed that each plant has a 100 percent yield (percentage output of acceptable quality). How would you modify your analysis to account for yield dif-ferences across plants?
6. What other factors should be accounted for when making your recommendations?
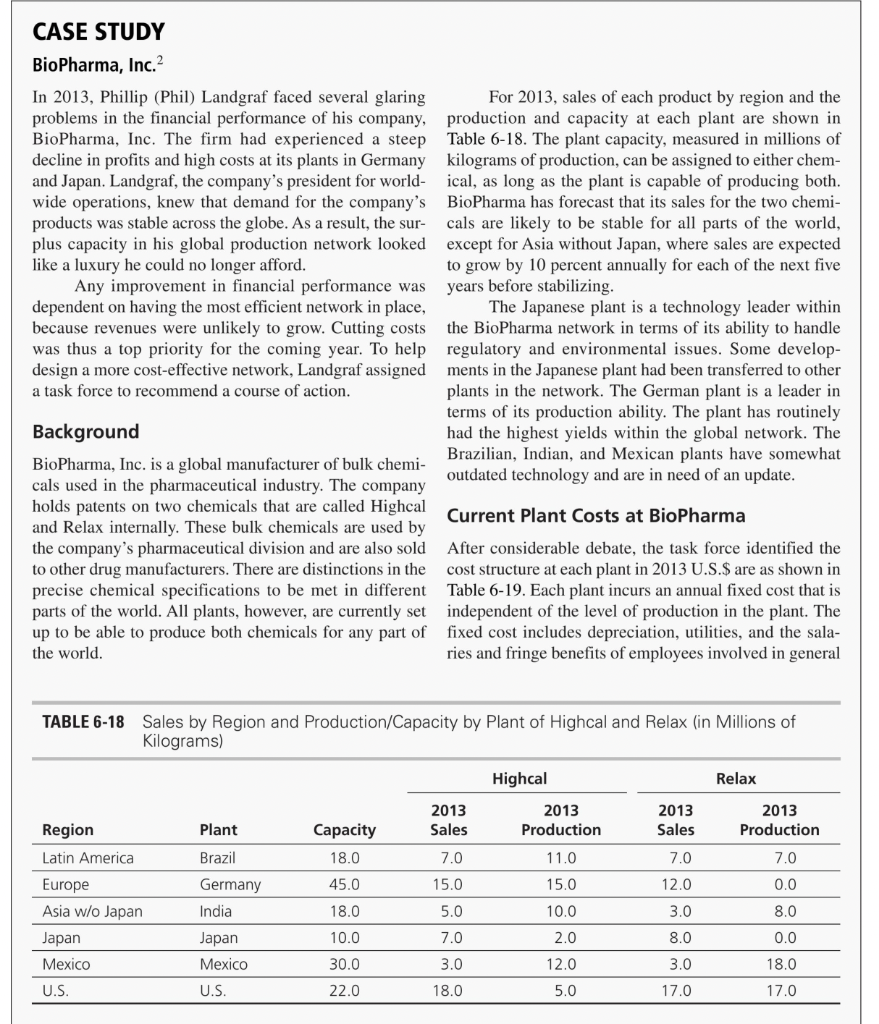
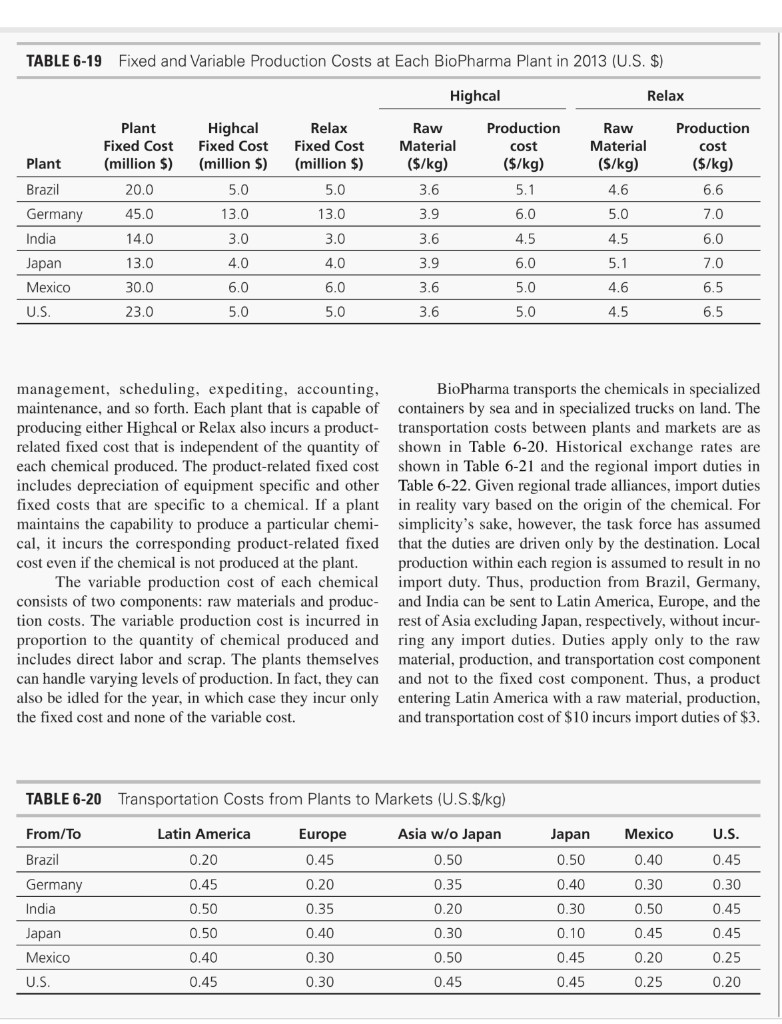
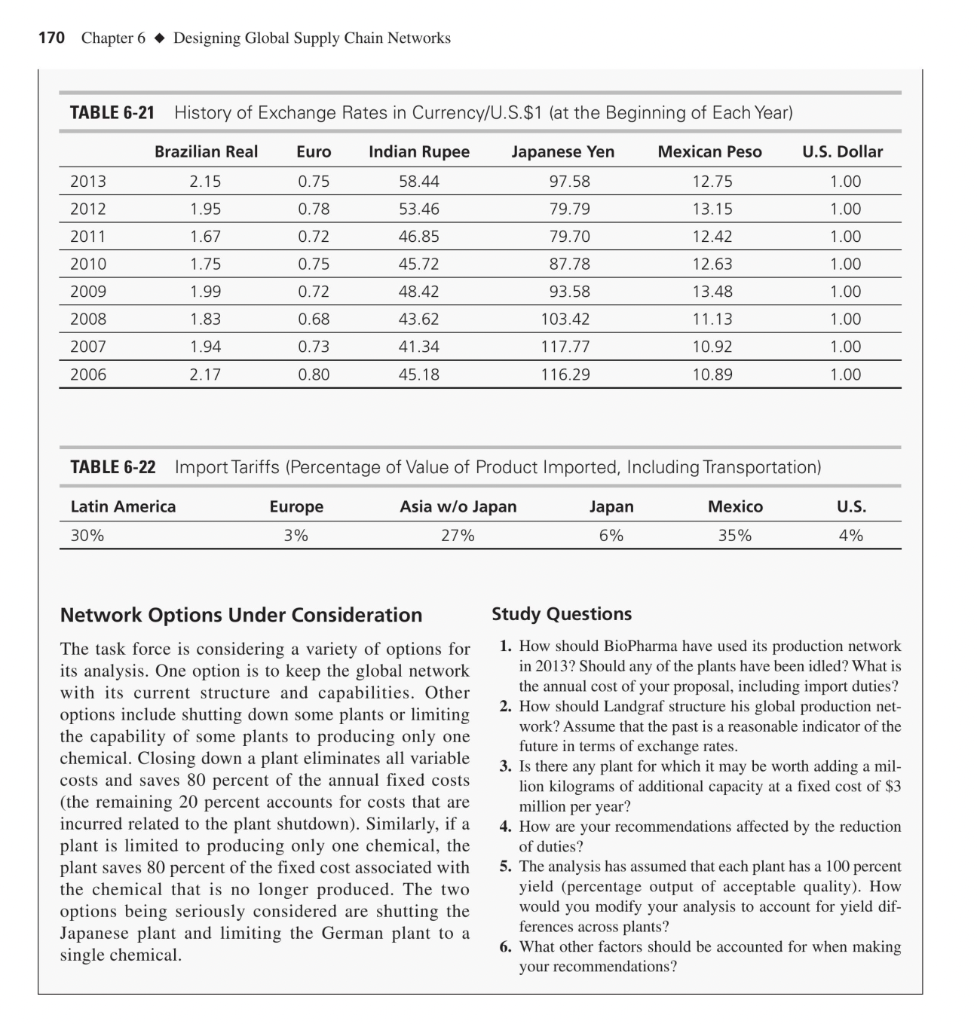
CASE STUDY BioPharma, Inc. In 2013, Phillip (Phil) Landgraf faced several glaring For 2013, sales of each product by region and the problems in the financial performance of his company, production and capacity at each plant are shown in BioPharma, Inc. The firm had experienced a steep Table 6-18. The plant capacity, measured in millions of decline in profits and high costs at its plants in Germany kilograms of production, can be assigned to either chem- and Japan. Landgraf, the company's president for world- ical, as long as the plant is capable of producing both. wide operations, knew that demand for the company's BioPharma has forecast that its sales for the two chemi- products was stable across the globe. As a result, the sur- cals are likely to be stable for all parts of the world, plus capacity in his global production network looked except for Asia without Japan, where sales are expected like a luxury he could no longer afford. to grow by 10 percent annually for each of the next five Any improvement in financial performance was years before stabilizing. dependent on having the most efficient network in place, The Japanese plant is a technology leader within because revenues were unlikely to grow. Cutting costs the BioPharma network in terms of its ability to handle was thus a top priority for the coming year. To help regulatory and environmental issues. Some develop- design a more cost-effective network, Landgraf assigned ments in the Japanese plant had been transferred to other a task force to recommend a course of action. plants in the network. The German plant is a leader in terms of its production ability. The plant has routinely Background had the highest yields within the global network. The BioPharma, Inc. is a global manufacturer of bulk chemi- Brazilian, Indian, and Mexican plants have somewhat cals used in the pharmaceutical industry. The company outdated technology and are in need of an update. holds patents on two chemicals that are called Highcal Current Plant Costs at BioPharma and Relax internally. These bulk chemicals are used by the company's pharmaceutical division and are also sold After considerable debate, the task force identified the to other drug manufacturers. There are distinctions in the cost structure at each plant in 2013 U.S.$ are as shown in precise chemical specifications to be met in different Table 6-19. Each plant incurs an annual fixed cost that is parts of the world. All plants, however, are currently set independent of the level of production in the plant. The up to be able to produce both chemicals for any part of fixed cost includes depreciation, utilities, and the sala- the world. ries and fringe benefits of employees involved in general TABLE 6-18 Sales by Region and Production/Capacity by Plant of Highcal and Relax (in Millions of Kilograms) Highcal Relax 2013 Sales Plant 2013 Production 2013 Sales 2013 Production Region Capacity Latin America Brazil 18.0 11.0 7.0 7.0 7.0 15.0 Germany 45.0 15.0 12.0 0.0 India 18.0 5.0 10.0 3.0 8.0 Europe Asia w/o Japan Japan Mexico 10.0 7.0 2.0 8.0 0.0 Japan Mexico U.S. 30.0 3.0 12.0 3.0 18.0 U.S. 22.0 18.0 5.0 17.0 17.0 TABLE 6-19 Fixed and Variable Production Costs at Each BioPharma Plant in 2013 (U.S. $) Highcal Relax Plant Fixed Cost (million S) Highcal Fixed Cost (million $) Relax Fixed Cost (million $) Raw Material ($/kg) 3.6 Production cost ($/kg) Raw Material ($/kg) Plant Production cost ($/kg) 6.6 Brazil 20.0 5.0 5.1 4.6 5.0 13.0 45.0 13.0 3.9 6.0 5.0 7.0 Germany India 14.0 3.0 3.6 4.5 4.5 6.0 3.0 4.0 13.0 4.0 3.9 6.0 5.1 7.0 Japan Mexico 6.0 6.0 3.6 5.0 4.6 30.0 23.0 6.5 6.5 U.S. 5.0 5.0 3.6 5.0 4.5 management, scheduling, expediting, accounting, BioPharma transports the chemicals in specialized maintenance, and so forth. Each plant that is capable of containers by sea and in specialized trucks on land. The producing either Highcal or Relax also incurs a product- transportation costs between plants and markets are as related fixed cost that is independent of the quantity of shown in Table 6-20. Historical exchange rates are each chemical produced. The product-related fixed cost shown in Table 6-21 and the regional import duties in includes depreciation of equipment specific and other Table 6-22. Given regional trade alliances, import duties fixed costs that are specific to a chemical. If a plant in reality vary based on the origin of the chemical. For maintains the capability to produce a particular chemi- simplicity's sake, however, the task force has assumed cal, it incurs the corresponding product-related fixed that the duties are driven only by the destination. Local cost even if the chemical is not produced at the plant. production within each region is assumed to result in no The variable production cost of each chemical import duty. Thus, production from Brazil, Germany, consists of two components: raw materials and produc- and India can be sent to Latin America, Europe, and the tion costs. The variable production cost is incurred in rest of Asia excluding Japan, respectively, without incur- proportion to the quantity of chemical produced and ring any import duties. Duties apply only to the raw includes direct labor and scrap. The plants themselves material, production, and transportation cost component can handle varying levels of production. In fact, they can and not to the fixed cost component. Thus, a product also be idled for the year, in which case they incur only entering Latin America with a raw material, production, the fixed cost and none of the variable cost. and transportation cost of $10 incurs import duties of $3. TABLE 6-20 Transportation Costs from Plants to Markets (U.S.$/kg) From/To Latin America Japan Mexico U.S. Europe 0.45 Asia w/o Japan 0.50 Brazil 0.50 0.40 0.45 0.20 0.45 0.20 0.40 0.30 0.30 Germany India 0.35 0.20 0.50 0.35 0.30 0.50 0.45 0.50 0.40 0.30 0.10 0.45 0.45 Japan Mexico U.S. 0.40 0.30 0.50 0.45 0.20 0.25 0.45 0.30 0.45 0.45 0.25 0.20 170 Chapter 6 . Designing Global Supply Chain Networks TABLE 6-21 History of Exchange Rates in Currency/U.S.$1 (at the Beginning of Each Year) Brazilian Real Euro Mexican Peso U.S. Dollar 2013 2.15 0.75 12.75 1.00 Indian Rupee 58.44 53.46 46.85 0.78 2012 2011 1.00 1.95 1.67 Japanese Yen 97.58 79.79 79.70 87.78 13.15 12.42 0.72 1.00 2010 0.75 45.72 12.63 1.00 1.75 1.99 2009 0.72 48.42 93.58 13.48 1.00 2008 1.83 0.68 43.62 103.42 11.13 1.00 2007 1.94 0.73 117.77 10.92 1.00 41.34 45.18 2006 2.17 0.80 116.29 10.89 1.00 TABLE 6-22 Import Tariffs (Percentage of Value of Product Imported, Including Transportation) Mexico U.S. Latin America 30% Europe 3% Asia w/o Japan 27% Japan 6% 35% 4% Network Options Under Consideration The task force is considering a variety of options for its analysis. One option is to keep the global network with its current structure and capabilities. Other options include shutting down some plants or limiting the capability of some plants to producing only one chemical. Closing down a plant eliminates all variable costs and saves 80 percent of the annual fixed costs (the remaining 20 percent accounts for costs that are incurred related to the plant shutdown). Similarly, if a plant is limited to producing only one chemical, the plant saves 80 percent of the fixed cost associated with the chemical that is no longer produced. The two options being seriously considered are shutting the Japanese plant and limiting the German plant to a single chemical Study Questions 1. How should BioPharma have used its production network in 2013? Should any of the plants have been idled? What is the annual cost of your proposal, including import duties? 2. How should Landgraf structure his global production net- work? Assume that the past is a reasonable indicator of the future in terms of exchange rates. 3. Is there any plant for which it may be worth adding a mil- lion kilograms of additional capacity at a fixed cost of $3 million per year? 4. How are your recommendations affected by the reduction of duties? 5. The analysis has assumed that each plant has a 100 percent yield (percentage output of acceptable quality). How would you modify your analysis to account for yield dif- ferences across plants? 6. What other factors should be accounted for when making your recommendations


