

Question: 6. The table shows two sloth populations growing over time. time (years since 1990) 0 1 (From Unit 1, Lesson 10.) 2 3 4
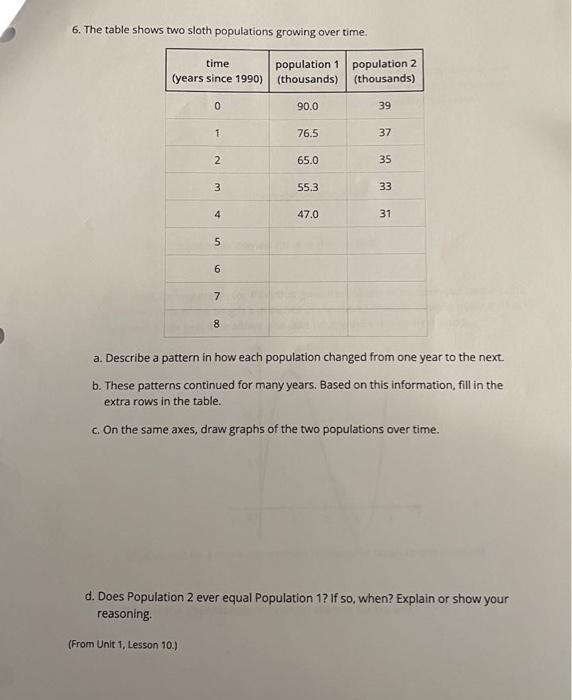
6. The table shows two sloth populations growing over time. time (years since 1990) 0 1 (From Unit 1, Lesson 10.) 2 3 4 5 6 7 8 population 1 population 2 (thousands) (thousands) 39 90.0 76.5 65.0 55.3 47.0 37 35 33 31 a. Describe a pattern in how each population changed from one year to the next. b. These patterns continued for many years. Based on this information, fill in the extra rows in the table. c. On the same axes, draw graphs of the two populations over time. d. Does Population 2 ever equal Population 1? If so, when? Explain or show your reasoning.
Step by Step Solution
3.23 Rating (158 Votes )
There are 3 Steps involved in it
Answer 1 General guidance The answer provided below has been developed in a clear step by step manne... View full answer

Get step-by-step solutions from verified subject matter experts