

Question: answer a and b in a paragraph Learning Objectives for Popot, 1976: By the end of this activity, students will be able to - Describe
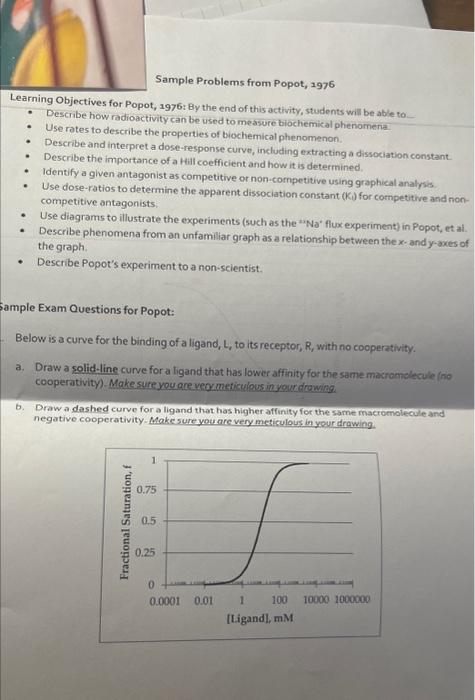
Learning Objectives for Popot, 1976: By the end of this activity, students will be able to - Describe how radioactivity can be used to measure biochemical phenomena. - Use rates to describe the properties of biochemical phenomenon. - Describe and interpret a dose-response curve, including extracting a dissociation constant. - Describe the importance of a Hill coefficient and how it is determined. - Identify a given antagonist as competitive or non-competitive using graphical analysis. - Use dose-ratios to determine the apparent dissociation constant (Ki) for competitive and noncompetitive antagonists; - Use diagrams to illustrate the experiments (such as the "'Na' flux experiment) in Popot, et ai. - Describe phenomena from an unfamiliar graph as a relationship between the x - and y-axes of the graph. - Describe Popot's experiment to a non-scientist. Sample Exam Questions for Popot: Below is a curve for the binding of a ligand, L, to its receptor, R, with no cooperativity. a. Draw a solid-line curve for a ligand that has lower affinity for the same macromelecule (no cooperativity). Makesure youare veoumeticulous in yourdowing. b. Draw a dashed curve for a ligand that has higher affinity for the same macromolecule and negative cooperativity. Make sure younce very meticulous in your drawing. Learning Objectives for Popot, 1976: By the end of this activity, students will be able to - Describe how radioactivity can be used to measure biochemical phenomena. - Use rates to describe the properties of biochemical phenomenon. - Describe and interpret a dose-response curve, including extracting a dissociation constant. - Describe the importance of a Hill coefficient and how it is determined. - Identify a given antagonist as competitive or non-competitive using graphical analysis. - Use dose-ratios to determine the apparent dissociation constant (Ki) for competitive and noncompetitive antagonists; - Use diagrams to illustrate the experiments (such as the "'Na' flux experiment) in Popot, et ai. - Describe phenomena from an unfamiliar graph as a relationship between the x - and y-axes of the graph. - Describe Popot's experiment to a non-scientist. Sample Exam Questions for Popot: Below is a curve for the binding of a ligand, L, to its receptor, R, with no cooperativity. a. Draw a solid-line curve for a ligand that has lower affinity for the same macromelecule (no cooperativity). Makesure youare veoumeticulous in yourdowing. b. Draw a dashed curve for a ligand that has higher affinity for the same macromolecule and negative cooperativity. Make sure younce very meticulous in your drawing
Step by Step Solution
There are 3 Steps involved in it

Get step-by-step solutions from verified subject matter experts