

Question: Answer A-C using the data attached in Tables 2, 2A, and 2B Describe the bivariate relationship in Table 2. Describe what Tables 2A and 2B

- Answer A-C using the data attached in Tables 2, 2A, and 2B
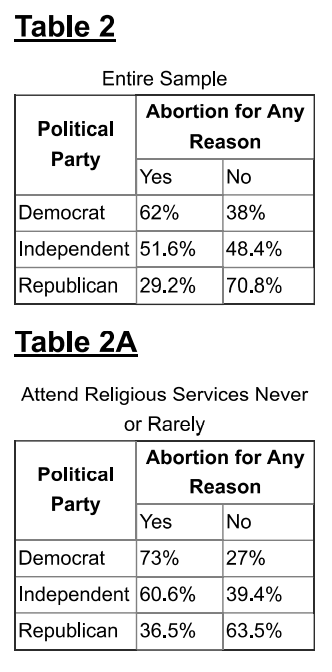
- Describe the bivariate relationship in Table 2.
- Describe what Tables 2A and 2B show regarding the effect of a control variable.
- Draw an arrow diagram to describe the relationship among these variables.

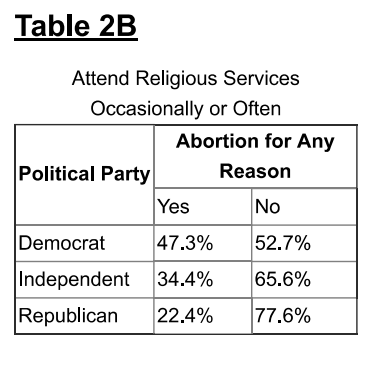
Table 2 Entire Sample Abortion for Any Reason Political Party Yes Democrat 62% 38% Independent 51.6% 48.4% Republican 29.2% 711.8% Table 2A Attend Religious Services Never or Rarely Abortion for Any Political Reason Party Yes Democrat 73% 2?% Independent 60.6% 39.4% Republican 36.5% 53.5% Table 2B Attend Religious Services Occasionally or Often Abortion for Any Political Party Reason Yes No Democrat 47.3% 52.7% Independent 34.4% 65.6% Republican 22.4% 77.6%
Step by Step Solution
There are 3 Steps involved in it
1 Expert Approved Answer
Step: 1 Unlock

Question Has Been Solved by an Expert!
Get step-by-step solutions from verified subject matter experts
Step: 2 Unlock
Step: 3 Unlock