

Question: Answer A-D please Data table nt the vertical axis and the S&P 500 (Cliek ron the folliminn ienn D. in order to copy its contents
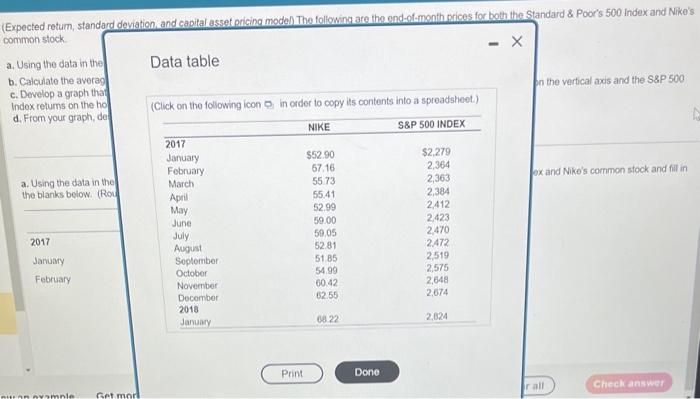
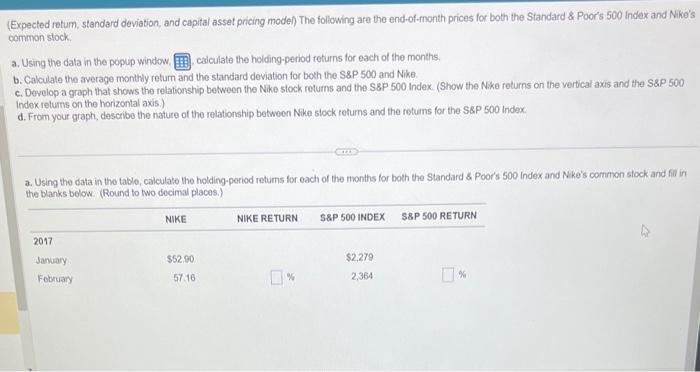
Data table nt the vertical axis and the S\&P 500 (Cliek ron the folliminn ienn D. in order to copy its contents into a spreadsheot.) ox and Nike's common stock and fill in (Expected rotum, standard deviation, and capital asset pricing moden) The following are the end-of-month prices for both the Standard & Poor's 500 Index and Nike's common stock. a. Using the dala in the popup window, calculate the holding-period returns for each of the months. b. Calculate the average monthly return and the standard doviation for both the S8P 500 and Nike. c. Develop a graph that shows the relationship between the Nike slock returns and the S8P 500 index. (Show the Nike returns on the vertical axis and the SaP 500 index returns on the horizontal axis.) d. From your graph, describe the nature of the relationship between Nike slock rotums and the roturns for the S8P 500 index a. Using the data in the tablo, calculate the holding-period returns for each of the months for both the Standard 4 Poor's 500 Index and Nke's common slock and fiti in the blanks below. (Round to two decimal places.)
Step by Step Solution
There are 3 Steps involved in it

Get step-by-step solutions from verified subject matter experts