

Question: answer all 4 parts Pate = Copy Format Pr Cipboard TextBox 11 Calody B/U A Font S 1 2 Revenue Cost of goods sold 4
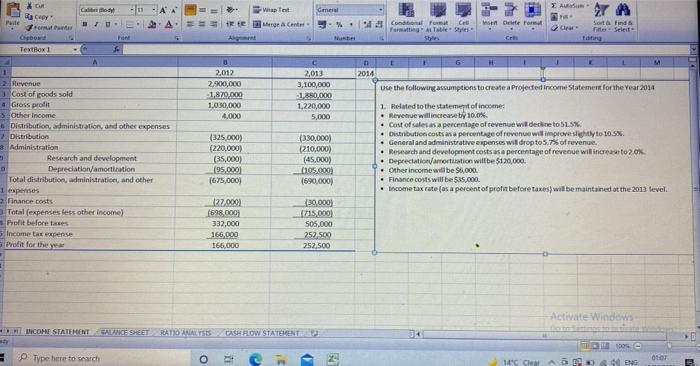
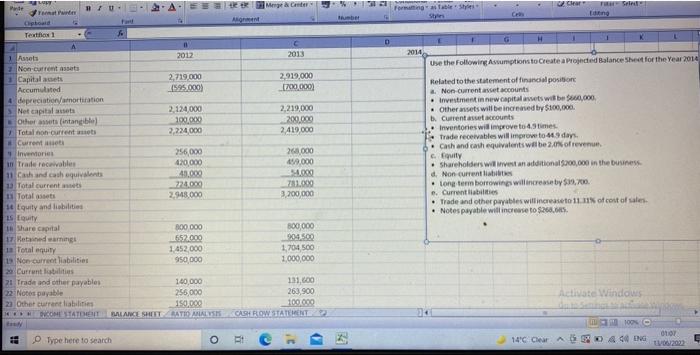
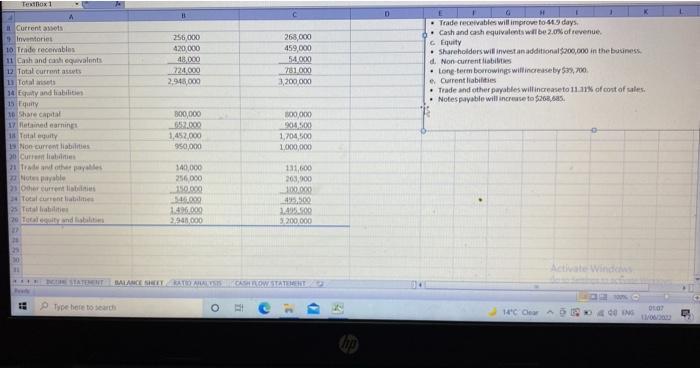
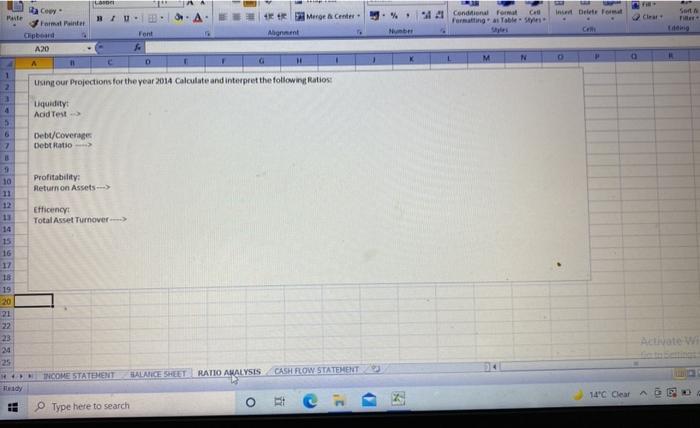
Pate = Copy Format Pr Cipboard TextBox 11 Calody B/U A Font S 1 2 Revenue Cost of goods sold 4 Gross profit S Other income Distribution, administration, and other expenses 7. Distribution Administration M Research and development D Depreciation/amortization Total distribution, administration, and other 1 expenses 2 Finance costs Total (expenses less other income) Profit before taxes 5 Income tax expense Profit for the year 2,012 2,900,000 -1,870,000 1,030,000 4,000 (325,000) (220,000) (35,000) (95,000) (675,000) (27,000) (698,000) 332,000 166,000 166,000 INCOME STATEMENT SALANCE SHEET RATIO ANALYSES Type here to search Wap Inst Merge & Center- O 11 CASH FLOW STATEMENT General 2,013 3,100,000 -1,880,000 1,220,000 5,000 (330,000) (210,000) (45,000) (105,000) (690,000) (30,000) (715,000) 505,000 252,500 252,500 31 >> %. Nubi 54 TA set Delete Format Condal Format Cel Formatting Table Styles Sort & Find & Filter Select tating t F 6 H K M D 2014 Use the following assumptions to create a Projected Income Statement for the Year 2014 1. Related to the statement of income: Revenue will increase by 10.0%. Cost of sales as a percentage of revenue will decline to 51.5%. Distribution costs as a percentage of revenue will improve slightly to 10.5%. General and administrative expenses will drop to 5.7% of revenue. Research and development costs as a percentage of revenue will increase to 2.0% Depreciation/amortization will be $120,000. Other income will be $6,000. Finance costs will be $35,000. Income tax rate (as a percent of profit before taxes) will be maintained at the 2013 level. Activate Windows 100% C AGEK 40 ENG E Autum F 14C Clear 0107 Pante grupp te Menge & Center % Alignment Number 11 2012 C 2013 2,719,000 2,919,000 (595,000) [700,000) 2,124,000 2,219,000 100,000 200,000 2,224,000 2,419,000 256,000 260,000 420,000 459,000 40.000 54.000 724,000 781.000 2,948,000 3,200,000 800,000 800,000 652.000 904.500 1,452,000 1,704,500 950,000 1,000,000 140,000 131,600 263,900 256,000 150,000 100.000 PVCOME STATEMENT BALANCE SHEET RATIO ANALYSIS CASH FLOW STATEMENT Type here to search Temat Painter RIU Opboard Textos 1 1 Assets, 2 Non-current assets 1 Capital amets Accumulated 4 depreciation/amortization SNet capital assets Other assets (intangible) Total non-current assets Current assets Inventories in Trade receivables 11 Cash and cash equivalents 13 Total current assets 11 Total assets 14 Equity and liabilities 15 Equity 18 Share capital 17 Retained earnings 1 Total equity 19 Non-current liabilities 20 Current liabilities 21 Trade and other payables 22 Notes payable 23 Other current liabilities Fart fo O a D Formatting as Table Styles Clear Fit-Seled: Eating G H K 2014 Use the following Assumptions to Create a Projected Balance Sheet for the Year 2014 Related to the statement of financial position a. Non-current asset accounts Investment in new capital assets will be $600,000 Other assets will be increased by $100,000. b. Current asset accounts Inventories will improve to 4.9 times. Trade receivables will improve to 449 days Cash and cash equivalents will be 2.0% of revenue. c. Equity Shareholders will invest an additional $200,000 in the business. d. Non-current liabilities Long term borrowings will increase by $39,700. e. Current liabilities Trade and other payables will increase to 11.11% of cost of sales Notes payable will increase to $268.05. Activate Windows da to Seturios ta 100% 01/07 14C Clear AD440ENG 13/06/2022 TextBox1 Current assets 9 Inventories 10 Trade recewables 11 Cash and cash equivalents 12 Total current assets 13 Total asets 14 Equity and liabilities 15 Equity 10 Share capital 17 Retained earnings 18 Total equity 19 Non current liabilities 30 Current liabilities 21 Trade and other payables 22 Notes payable 21 Other current liabilities 24 Total current liabilmes 25 Total liabilities 20 Total equity and liabilities P 20 30 W A 256,000 268,000 420,000 459,000 48,000 54,000 724,000 781.000 2,948,000 3,200,000 800,000 800,000 652.000 904.500 1,452,000 1,704,500 950,000 1,000,000 140,000 131,600 256,000 203,900 150.000 100.000 $45.000 495,500 1.496.000 1.495.500 2.945,000 5,200,000 DEUME STATEMENT BALANCE SHEET RATIO ANALYSIS CASH FLOW STATEMENT Type here to search D 1 G Trade receivables will improve to-44.9 days. Cash and cash equivalents will be 2.0% of revenue. Equity Shareholders will invest an additional $200,000 in the business d. Non-current liabilities Long-term borrowings will increase by $39,700 e. Current liabilities Trade and other payables will increaseto 11.11% of cost of sales. Notes payable will increase to $268,685. Activate Windows 14C Clear 440 ING DEMO 01.07 Lason BIU A F Format Painter Merge & Center - Clipboard Alignment A20 A 11 C D H 1 Using our Projections for the year 2014 Calculate and interpret the following Ratios: 2 3 Liquidity: 4 Acid Test-> Debt/Coverage Debt Ratio Profitability: Return on Assets--> Efficency: Total Asset Turnover---> INCOME STATEMENT BALANCE SHEET RATIO ANALYSIS CASH FLOW STATEMENT Type here to search Parte 5 2 Copy 6 7 B 9 10 11 12 13 14 15 16 17 18 19 20 21 22 23 24 25 H*** Ready # Font S Ri 3 D % Number Call Conditional Format Formatting as Table Styles Styles M N Insert Delete Format Ceffi O P 0 Clear Sort & Filler K Activate Wi 14C Clear 1830
Step by Step Solution
There are 3 Steps involved in it

Get step-by-step solutions from verified subject matter experts