

Question: Answer all a b c d please Question 1 In the table, you have 25 comparable companies along with information on P/E ratio, expected growth
Answer all a b c d please
Question 1
In the table, you have 25 comparable companies along with information on P/E ratio, expected growth in EPS, regression beta, and payout ratio. Assuming that P/E is modeled as a linear function of the three latter variables and using regression estimates based on the data, answer the following questions.
a. What is the coefficient estimate on payout ratio?
b. Is the sign of coefficient on beta aligned with what you would generally expect from a theoretical perspective (Yes/No)?
c. How many of the companies (out of 25) in the list are undervalued based on your predicted value of P/E ratio (using all of the variables in the regression (and including regression constant) regardless of statistical significance).
d. Which company is the most undervalued based on your calculations in c.?
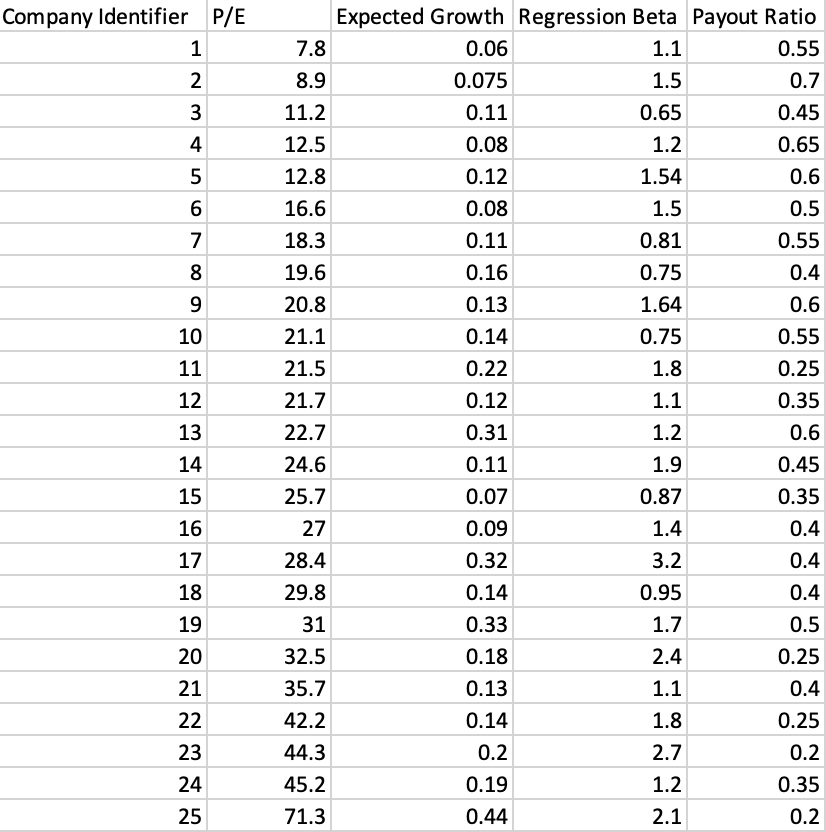
Company Identifier P/E 1 2 3 4 5 6 7 8 9 10 11 12 13 14 Expected Growth Regression Beta Payout Ratio 7.8 0.06 1.1 0.55 8.9 0.075 1.5 0.7 11.2 0.11 0.65 0.45 12.5 0.08 1.2 0.65 12.8 0.12 1.54 0.6 16.6 0.08 1.5 0.5 18.3 0.11 0.81 0.55 19.6 0.16 0.75 0.4 20.8 0.13 1.64 0.6 21.1 0.14 0.75 0.55 21.5 0.22 1.8 0.25 21.7 0.12 1.1 0.35 22.7 0.31 1.2 0.6 24.6 0.11 1.9 0.45 25.7 0.07 0.87 0.35 27 0.09 1.4 0.4 28.4 0.32 3.2 0.4 29.8 0.14 0.95 0.4 31 0.33 1.7 0.5 32.5 0.18 2.4 0.25 35.7 0.13 1.1 0.4 42.2 0.14 1.8 0.25 44.3 0.2 2.7 0.2 45.2 0.19 1.2 0.35 71.3 0.44 2.1 0.2 15 16 17 18 19 20 21 22 23 24 25 Company Identifier P/E 1 2 3 4 5 6 7 8 9 10 11 12 13 14 Expected Growth Regression Beta Payout Ratio 7.8 0.06 1.1 0.55 8.9 0.075 1.5 0.7 11.2 0.11 0.65 0.45 12.5 0.08 1.2 0.65 12.8 0.12 1.54 0.6 16.6 0.08 1.5 0.5 18.3 0.11 0.81 0.55 19.6 0.16 0.75 0.4 20.8 0.13 1.64 0.6 21.1 0.14 0.75 0.55 21.5 0.22 1.8 0.25 21.7 0.12 1.1 0.35 22.7 0.31 1.2 0.6 24.6 0.11 1.9 0.45 25.7 0.07 0.87 0.35 27 0.09 1.4 0.4 28.4 0.32 3.2 0.4 29.8 0.14 0.95 0.4 31 0.33 1.7 0.5 32.5 0.18 2.4 0.25 35.7 0.13 1.1 0.4 42.2 0.14 1.8 0.25 44.3 0.2 2.7 0.2 45.2 0.19 1.2 0.35 71.3 0.44 2.1 0.2 15 16 17 18 19 20 21 22 23 24 25
Step by Step Solution
There are 3 Steps involved in it

Get step-by-step solutions from verified subject matter experts