

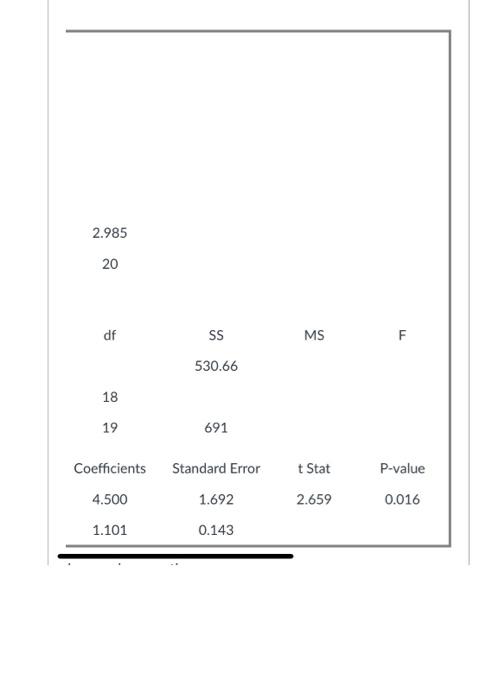
Question: answer all for upvote shown below. SUMMARY OUTPUT Regression Statistics Multiple R R Square Adjusted R Square Standard Error Observations 2.985 20 ANOVA df M
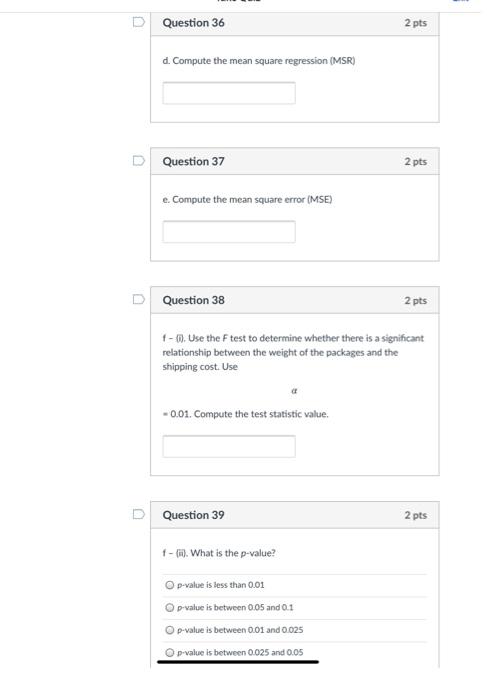
answer all for upvote 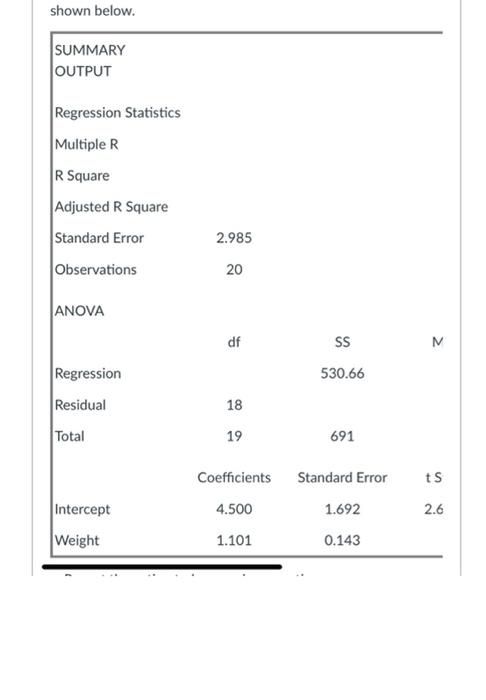
Step by Step Solution
There are 3 Steps involved in it
1 Expert Approved Answer
Step: 1 Unlock

Question Has Been Solved by an Expert!
Get step-by-step solutions from verified subject matter experts
Step: 2 Unlock
Step: 3 Unlock