

Question: answer all parts. dropdown options from top to bottom : the standard error is the estimated ______ (proportion, standard deviation, mean) of the ______ (sampling
answer all parts.
dropdown options from top to bottom :
the standard error is the estimated ______ (proportion, standard deviation, mean) of the ______ (sampling distribution, confidence interval) for the difference between the sample _____ (proportions, mean) in 2009 and 1997.
another one: there ____ (is, is no) evidence that the true proportion _____ (increased, decreased, changed) from 1997 to 2009 because the interval ______ (contains, does not contain) 0.
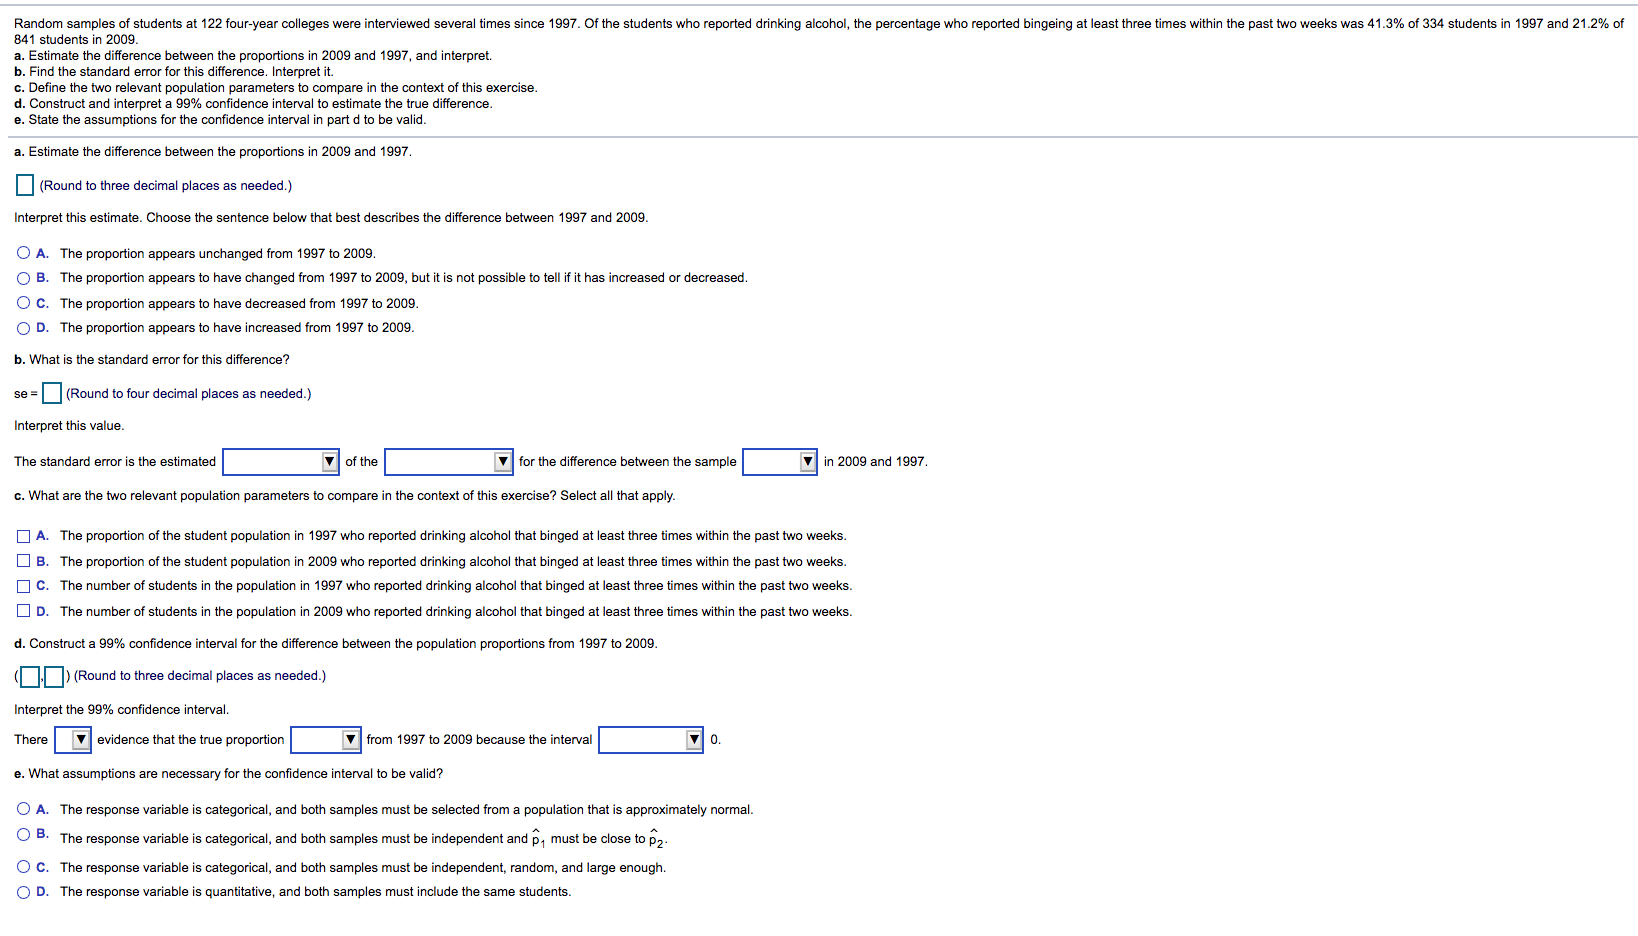
Random samples of students at 122 four-year colleges were interviewed several times since 1997. Of the students who reported drinking alcohol, the percentage who reported bingeing at least three times within the past two weeks was 41.3% of 334 students in 1997 and 21.2% of 841 students in 2009. a. Estimate the difference between the proportions in 2009 and 1997, and interpret. b. Find the standard error for this difference. Interpret it. c. Define the two relevant population parameters to compare in the context of this exercise. d. Construct and interpret a 99% confidence interval to estimate the true difference e. State the assumptions for the confidence interval in part d to be valid. a. Estimate the difference between the proportions in 2009 and 1997. (Round to three decimal places as needed.) Interpret this estimate. Choose the sentence below that best describes the difference between 1997 and 2009. O A. The proportion appears unchanged from 1997 to 2009. O B. The proportion appears to have changed from 1997 to 2009, but it is not possible to tell if it has increased or decreased. O C. The proportion appears to have decreased from 1997 to 2009. O D. The proportion appears to have increased from 1997 to 2009. b. What is the standard error for this difference? se = (Round to four decimal places as needed.) Interpret this value. The standard error is the estimated of the for the difference between the sample in 2009 and 1997. c. What are the two relevant population parameters to compare in the context of this exercise? Select all that apply. A. The proportion of the student population in 1997 who reported drinking alcohol that binged at least three times within the past two weeks. B. The proportion of the student population in 2009 who reported drinking alcohol that binged at least three times within the past two weeks. [ C. The number of students in the population in 1997 who reported drinking alcohol that binged at least three times within the past two weeks. D. The number of students in the population in 2009 who reported drinking alcohol that binged at least three times within the past two weeks. d. Construct a 99% confidence interval for the difference between the population proportions from 1997 to 2009. [[(Round to three decimal places as needed.) Interpret the 99% confidence interval. There e evidence that the true proportion from 1997 to 2009 because the interval e. What assumptions are necessary for the confidence interval to be valid? A. The response variable is categorical, and both samples must be selected from a population that is approximately normal. O B. The response variable is categorical, and both samples must be independent and p, must be close to p2. O C. The response variable is categorical, and both samples must be independent, random, and large enough. O D. The response variable is quantitative, and both samples must include the same students
Step by Step Solution
There are 3 Steps involved in it

Get step-by-step solutions from verified subject matter experts