

Question: Answer all parts. I'll rate Using a different classification model, you use the model on some testing data and generate the following table listing out
Answer all parts. I'll rate
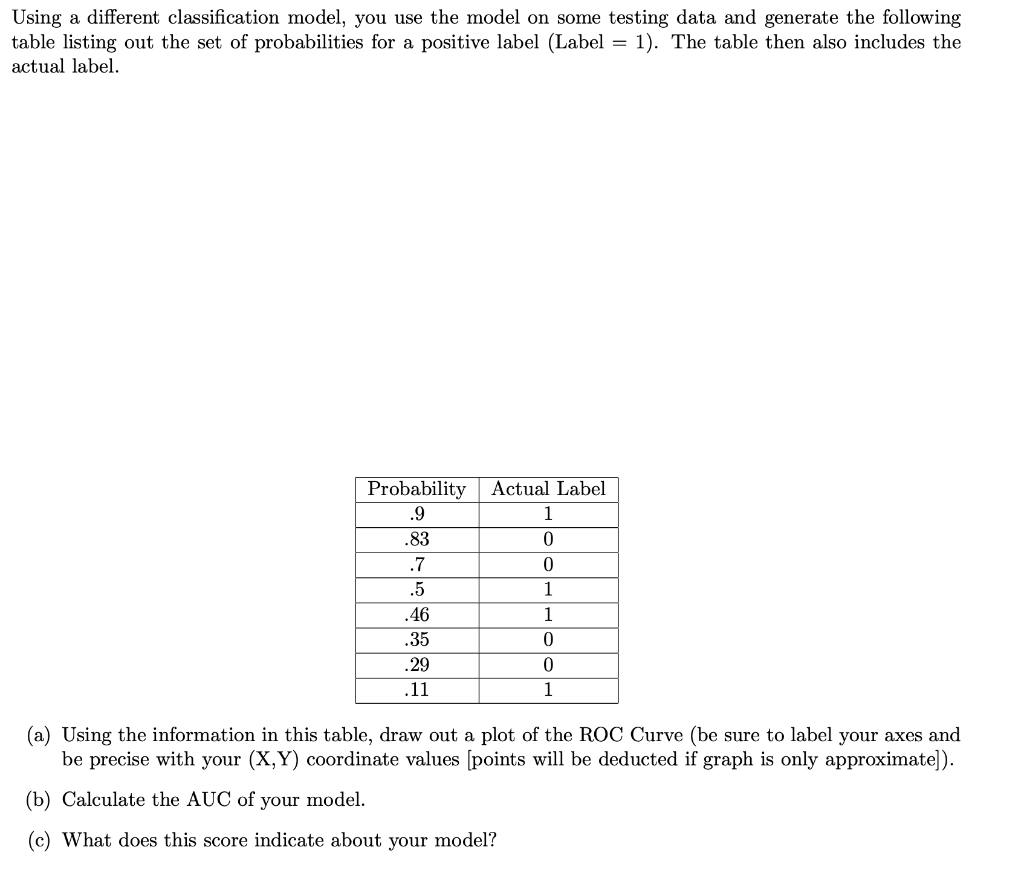
Using a different classification model, you use the model on some testing data and generate the following table listing out the set of probabilities for a positive label (Label = 1). The table then also includes the actual label. Probability Actual Label .9 83 OOH .7 .5 1 46 35 0 29 11 (a) Using the information in this table, draw out a plot of the ROC Curve (be sure to label your axes and be precise with your (X, Y) coordinate values [points will be deducted if graph is only approximate]). (b) Calculate the AUC of your model. (c) What does this score indicate about your model
Step by Step Solution
There are 3 Steps involved in it
1 Expert Approved Answer
Step: 1 Unlock

Question Has Been Solved by an Expert!
Get step-by-step solutions from verified subject matter experts
Step: 2 Unlock
Step: 3 Unlock