

Question: Answer all parts with Step by step calculation. Don't submit only explanation. I will give negative rating if you submit only explanation. The success of
Answer all parts with Step by step calculation. Don't submit only explanation. I will give negative rating if you submit only explanation.

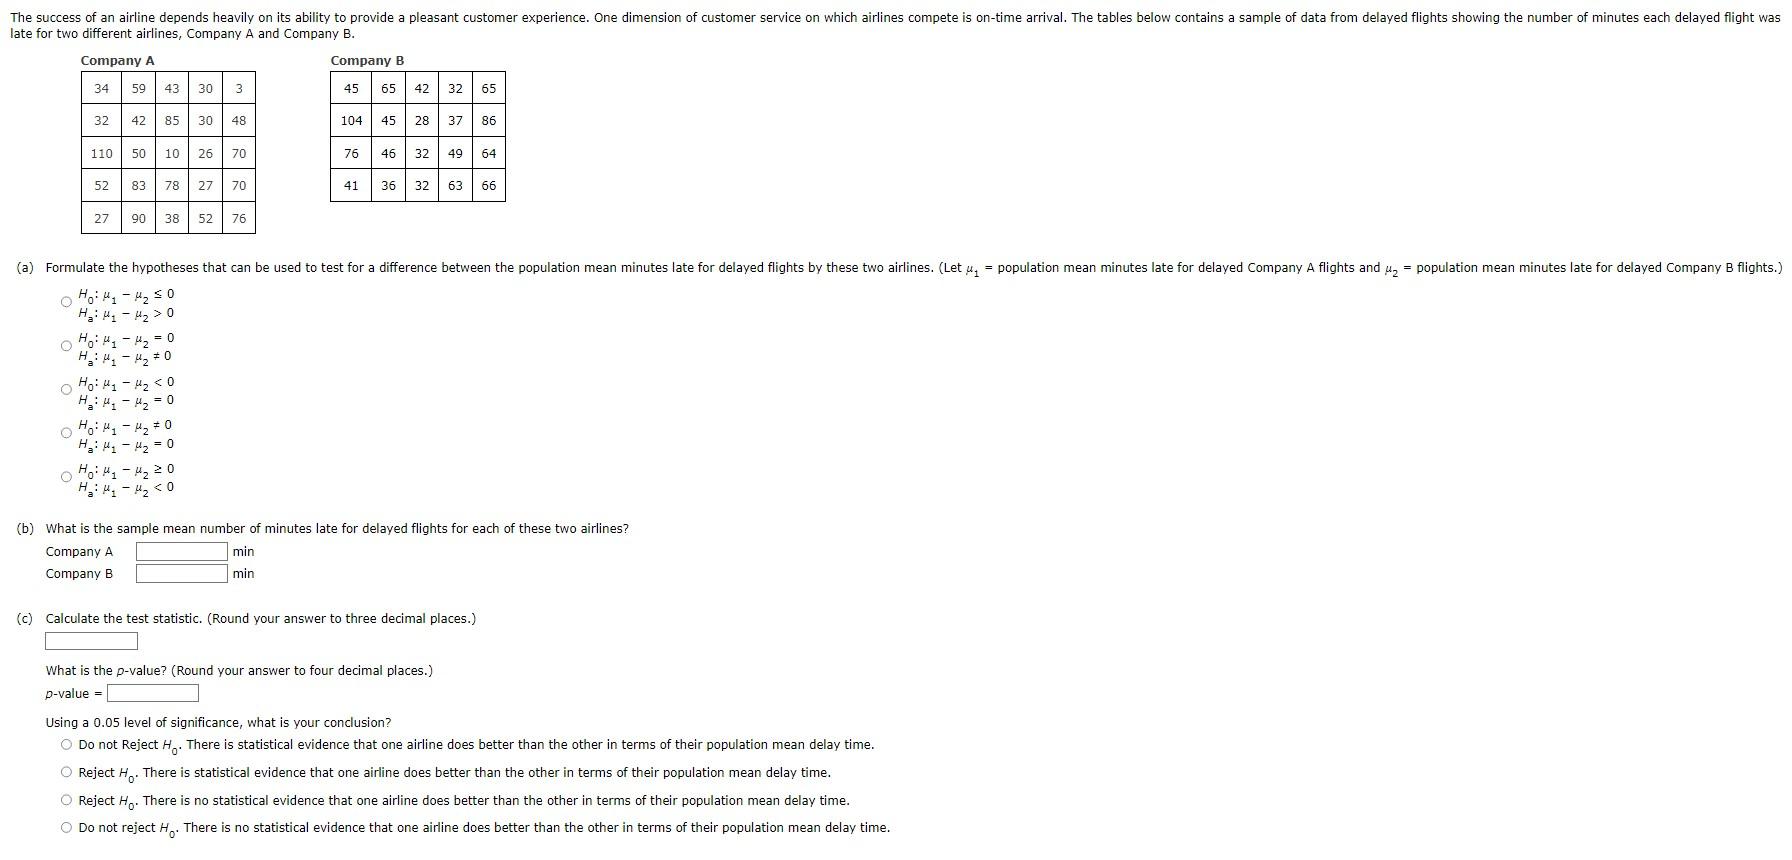
The success of an airline depends heavily on its ability to provide a pleasant customer experience. One dimension of customer service on which airlines compete is on-time arrival. The tables below contains a sample of data from delayed flights showing the number of minutes each delayed flight was late for two different airlines, Company A and Company B. Company A Company B 34 59 43 30 3 45 55 42 32 65 32 47 85 30 48 104 28 37 110 50 10 26 70 76 46 32 49 64 52 83 27 70 41 36 32 63 66 27 90 38 52 76 (a) Formulate the hypotheses that can be used to test for a difference between the population mean minutes late for delayed flights by these two airlines. (Let u, = population mean minutes late for delayed Company A flights and #2 = population mean minutes late for delayed Company B flights.) 0' 1 2 4, =0 H : U, - 4, =0 Ho: H1 - 42
Step by Step Solution
There are 3 Steps involved in it

Get step-by-step solutions from verified subject matter experts